Open Access
Fig. 3
Download original image
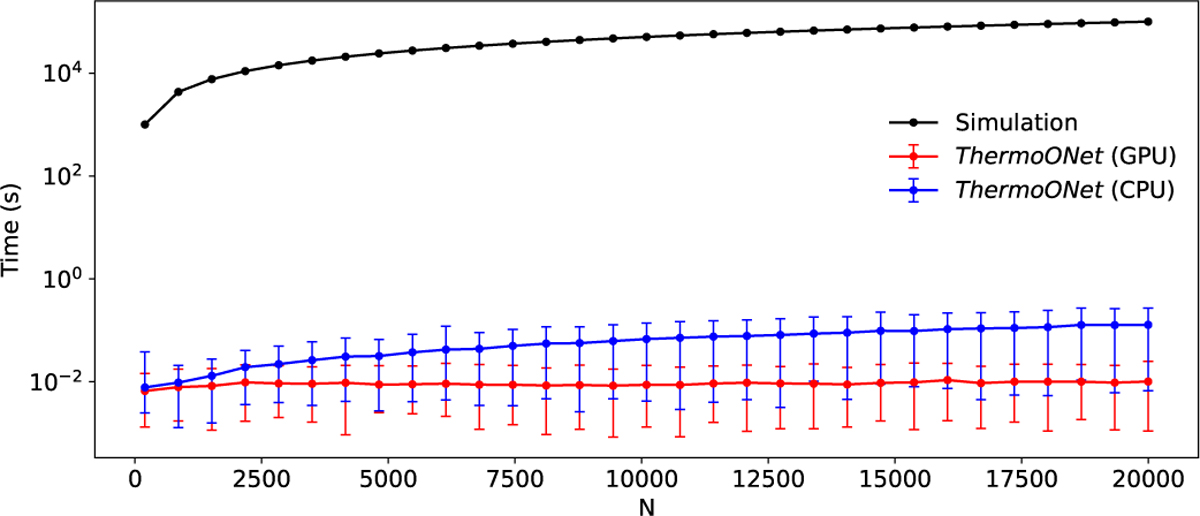
Comparison of computational cost between ThermoONet and traditional numerical simulation for the shape models with varying number of facets. The error bars represent the maximum and minimum time costs in the repeated calculation for more than 20 times.
Current usage metrics show cumulative count of Article Views (full-text article views including HTML views, PDF and ePub downloads, according to the available data) and Abstracts Views on Vision4Press platform.
Data correspond to usage on the plateform after 2015. The current usage metrics is available 48-96 hours after online publication and is updated daily on week days.
Initial download of the metrics may take a while.