Fig. 7.
Download original image
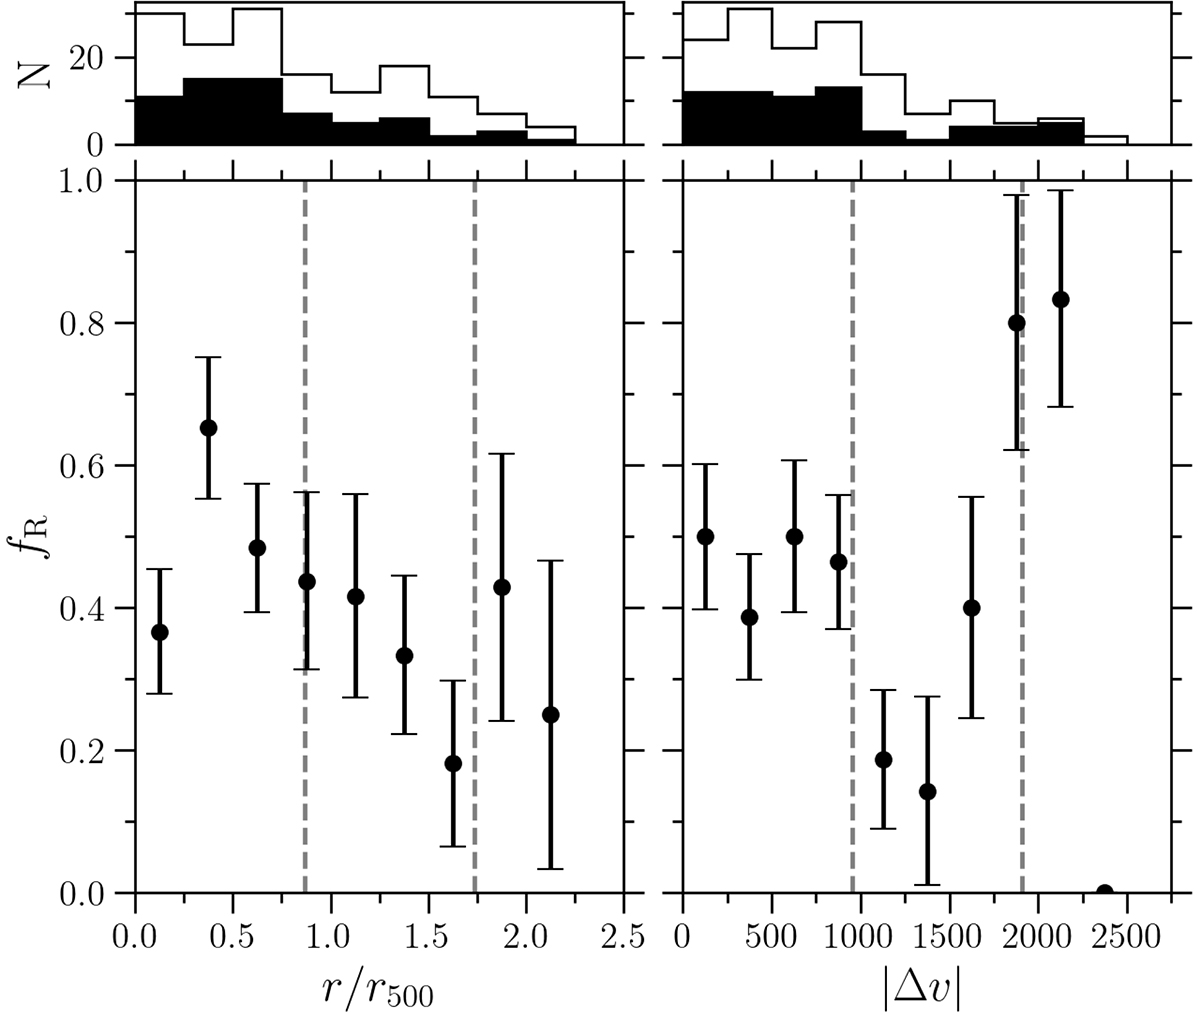
Fraction of spectroscopically confirmed cluster members that are detected in radio as a function of distance (left) and velocity offset (right, in km s−1 units) from the BCG. Vertical dashed lines mark the position of 1× and 2× the MeerKAT FWHM and the Ophiuchus galaxy velocity dispersion. The histograms show the distributions of the total number of spectroscopically confirmed cluster members (line) and the subsample of those detected in radio (color).
Current usage metrics show cumulative count of Article Views (full-text article views including HTML views, PDF and ePub downloads, according to the available data) and Abstracts Views on Vision4Press platform.
Data correspond to usage on the plateform after 2015. The current usage metrics is available 48-96 hours after online publication and is updated daily on week days.
Initial download of the metrics may take a while.