Fig. 3.
Download original image
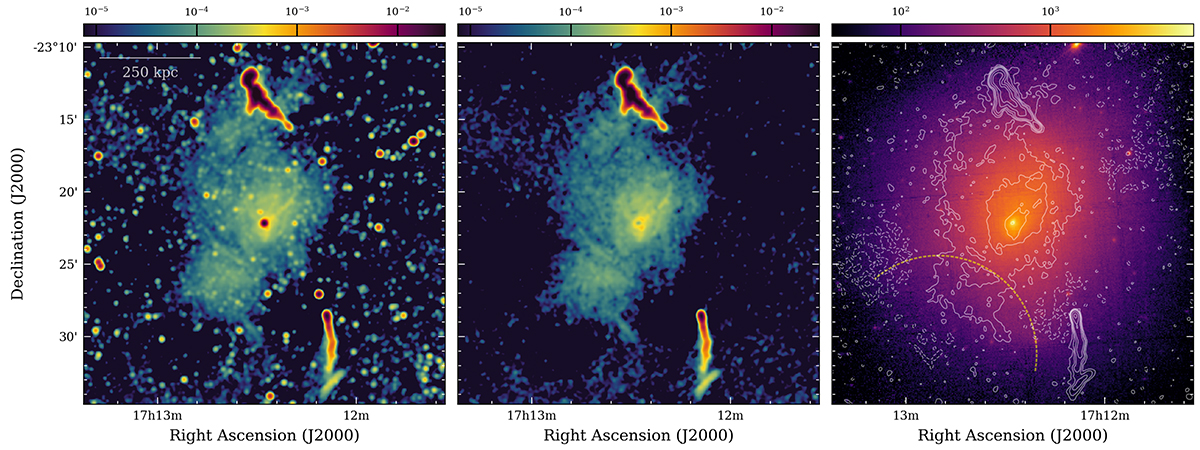
Radio diffuse emission and its connection with the thermal gas. The left and central panels show the MeerKAT taper-15″ images before and after source subtraction. The right panel shows an XMM-Newton wavelet cleaned image in the 0.5–2.5 keV band where the contours from the MeerKAT image shown in the central panel are drawn at levels of [–0.03, 0.03, 0.10, 0.25, 0.80, 5, 20] mJy beam−1 (the negative contour is reported in dashed). The yellow arc marks the X-ray concave edge. The color bar units are Jansky beam−1 for the radio images and counts for the X-ray image.
Current usage metrics show cumulative count of Article Views (full-text article views including HTML views, PDF and ePub downloads, according to the available data) and Abstracts Views on Vision4Press platform.
Data correspond to usage on the plateform after 2015. The current usage metrics is available 48-96 hours after online publication and is updated daily on week days.
Initial download of the metrics may take a while.