Fig. 4.
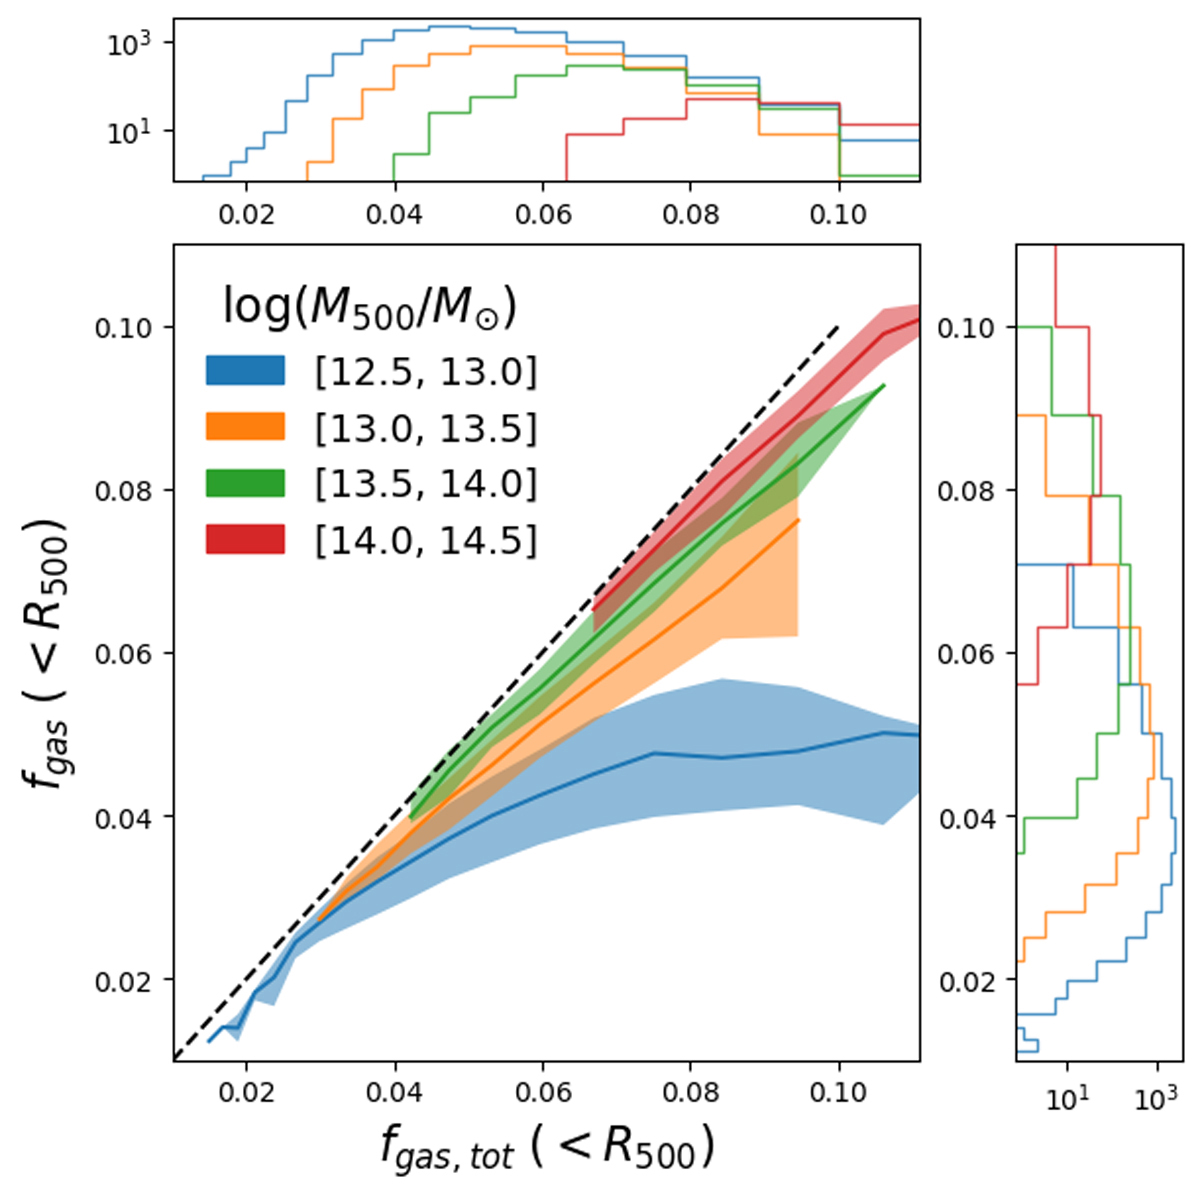
Download original image
Hot gas fraction as a function of the total gas fraction within R500. In the central panel, each solid line represents a halo mass bin M500 with the associated 16–84th percentile. The dashed black line represents the 1:1 relation. In the lateral panels, we report the number counts of the halos of fgas, tot (top) and fgas (right) used to calculate the median and errors.
Current usage metrics show cumulative count of Article Views (full-text article views including HTML views, PDF and ePub downloads, according to the available data) and Abstracts Views on Vision4Press platform.
Data correspond to usage on the plateform after 2015. The current usage metrics is available 48-96 hours after online publication and is updated daily on week days.
Initial download of the metrics may take a while.