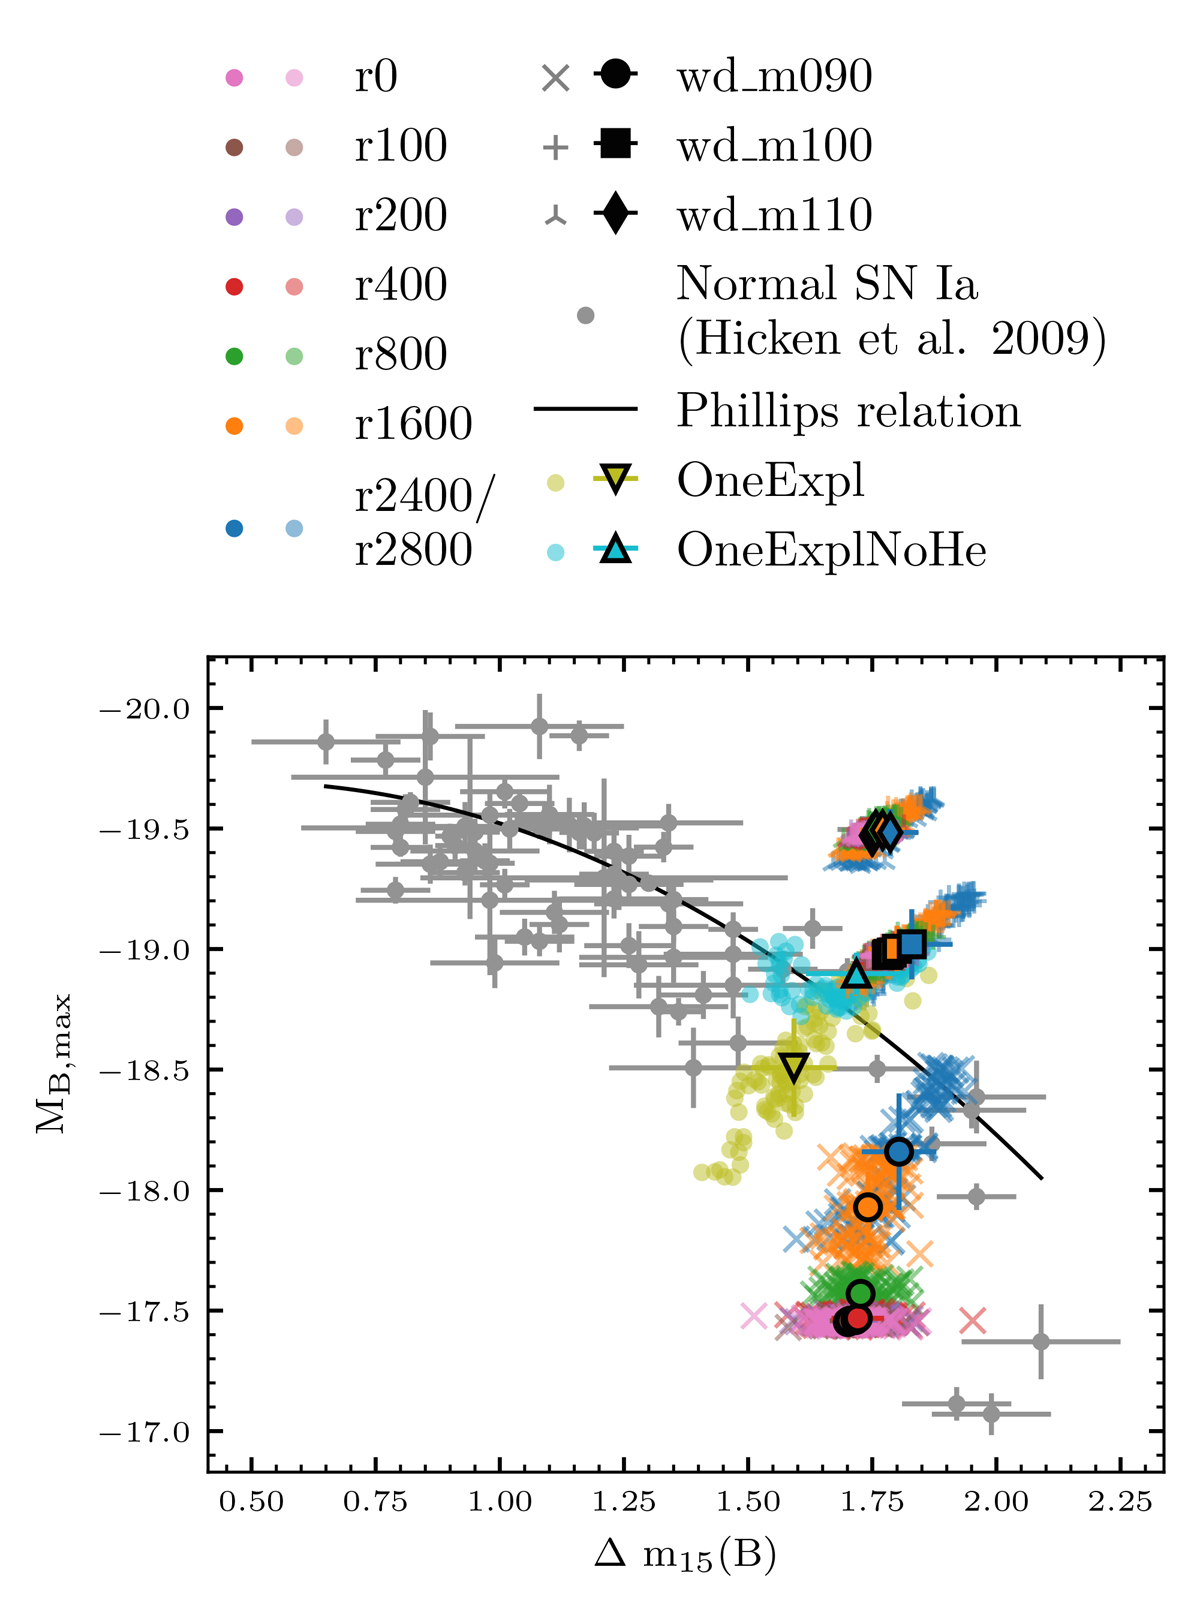
Fig. 5.
Download original image
Illustration of the peak B band magnitudes and decline rates of our models in the context of the Phillips relation. Here the translucent glyphs represent the individual viewing angles while the symbols outlined in black indicate the mean values and the connected standard deviations. The peak B band magnitude is calculated for the peak of each line of sight individually. We also show observational data of Hicken et al. (2009). Absolute magnitudes for the observational data have been computed assuming H0 = 70.2 km s−1 Mpc−1. Objects with a distance modulus of μ < 33 have been excluded. The ONEEXPL and ONEEXPLNOHE data is the same as the one presented in Pollin et al. (2024).
Current usage metrics show cumulative count of Article Views (full-text article views including HTML views, PDF and ePub downloads, according to the available data) and Abstracts Views on Vision4Press platform.
Data correspond to usage on the plateform after 2015. The current usage metrics is available 48-96 hours after online publication and is updated daily on week days.
Initial download of the metrics may take a while.