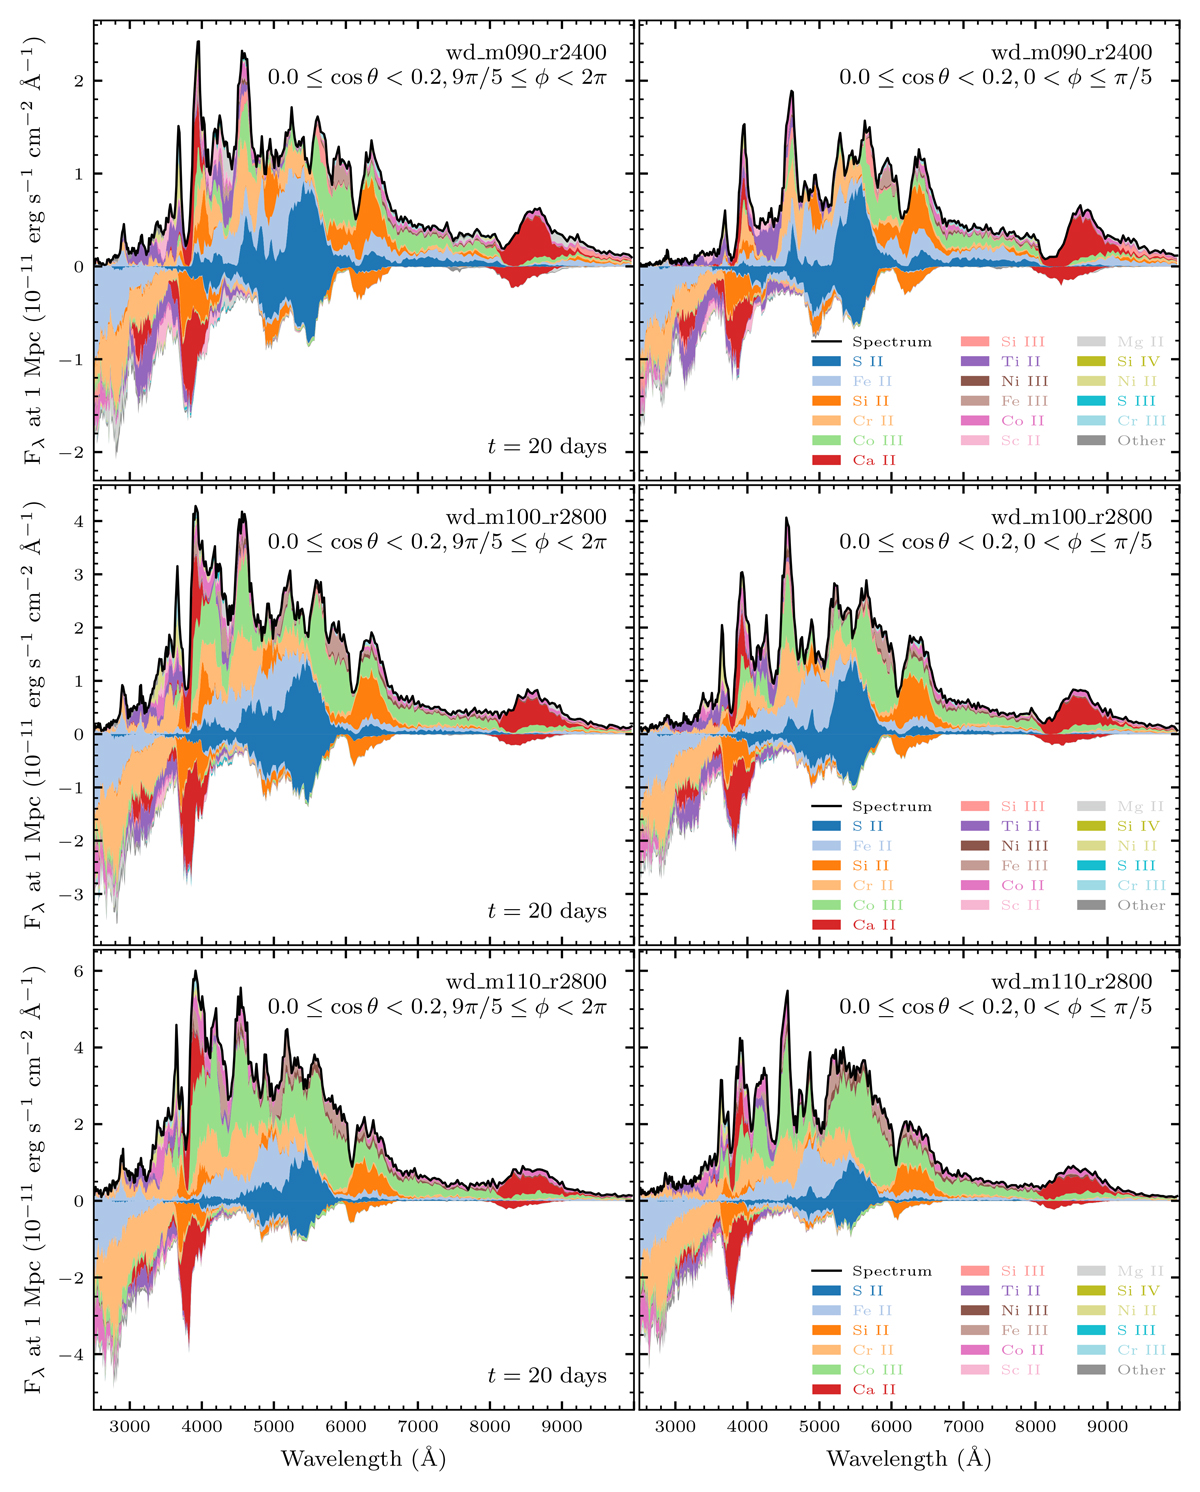
Fig. 4.
Download original image
Spectral energy density for our most asymmetrically ignited models. Here we show two opposing lines of sight 20 days after the explosions. The left column corresponds roughly to the north pole of Figure 1, whereas the right column point toward the south pole. In each panel, the black line describes the overall synthetic flux, while colored layers illustrate the contributions of individual ions to the overall emitted and absorbed flux. Here, the largest difference in flux can be seen in the blue wavelengths below approximately 4500 Å, caused by line blanketing of certain IGEs.
Current usage metrics show cumulative count of Article Views (full-text article views including HTML views, PDF and ePub downloads, according to the available data) and Abstracts Views on Vision4Press platform.
Data correspond to usage on the plateform after 2015. The current usage metrics is available 48-96 hours after online publication and is updated daily on week days.
Initial download of the metrics may take a while.