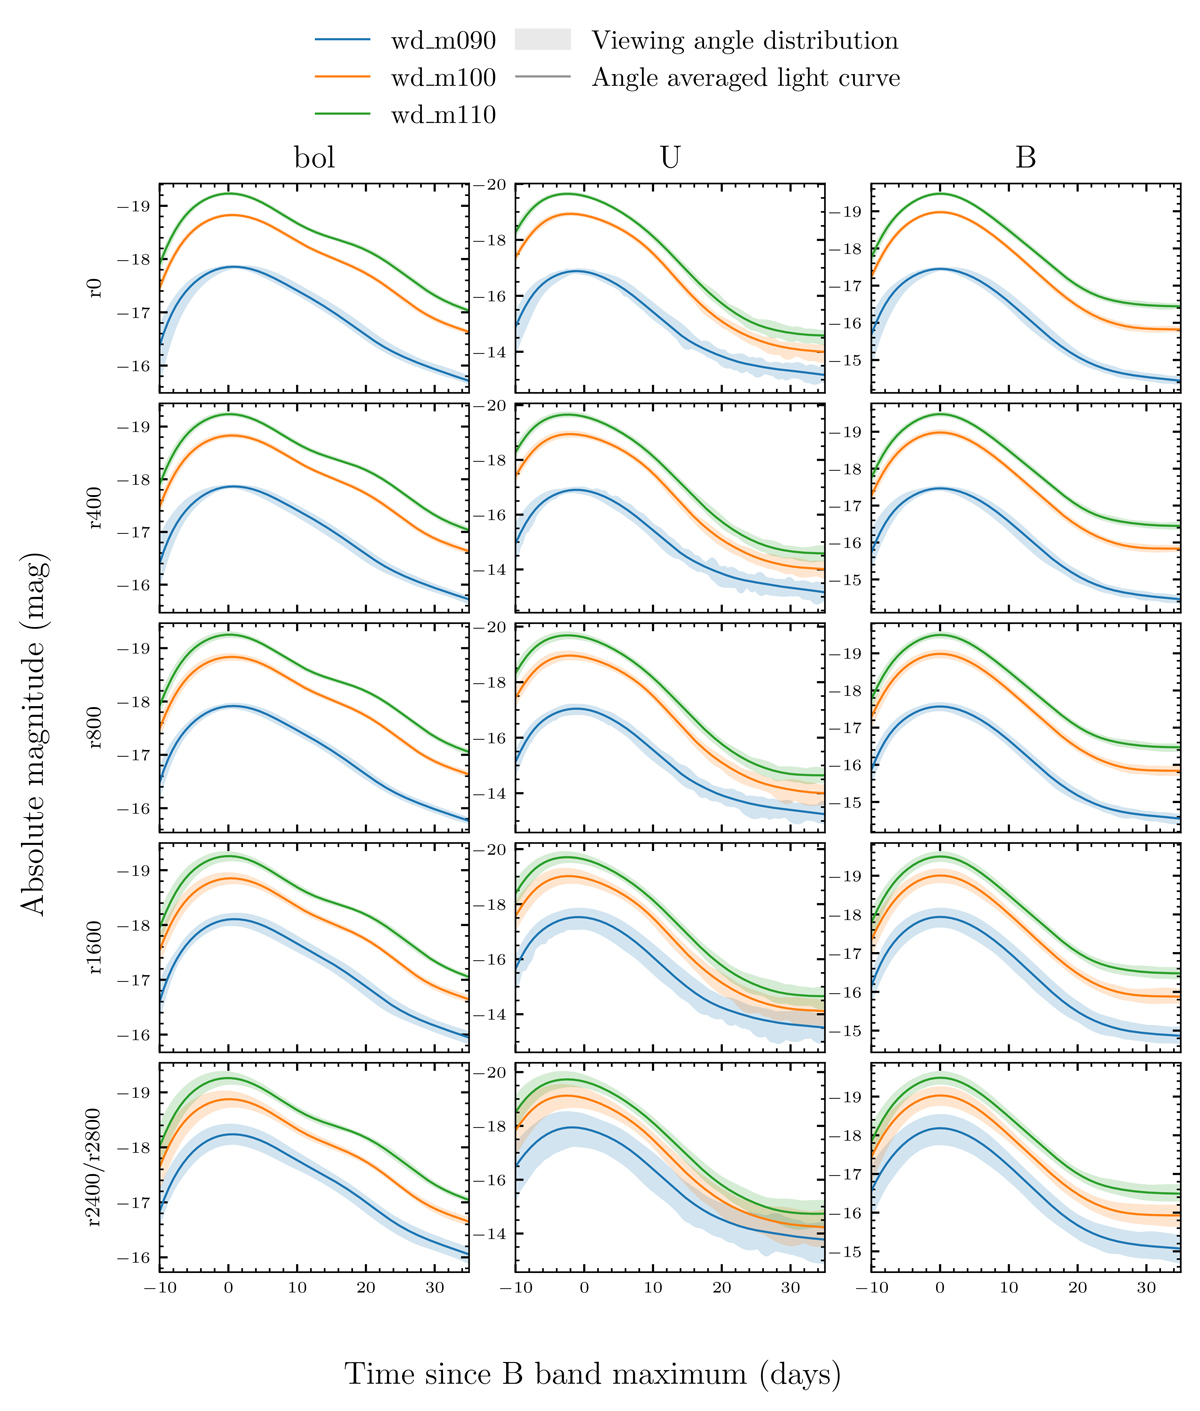
Fig. 3.
Download original image
Bolometric, U and B band light curves of our models. Here, the solid lines show the angle averaged light curves, whereas the shaded regions indicate the variability for different viewing angles; that is, the minimum and maximum of each light curve. The jagged features in some of the viewing angle distributions are due to noise in the individual viewing angle light curves.
Current usage metrics show cumulative count of Article Views (full-text article views including HTML views, PDF and ePub downloads, according to the available data) and Abstracts Views on Vision4Press platform.
Data correspond to usage on the plateform after 2015. The current usage metrics is available 48-96 hours after online publication and is updated daily on week days.
Initial download of the metrics may take a while.