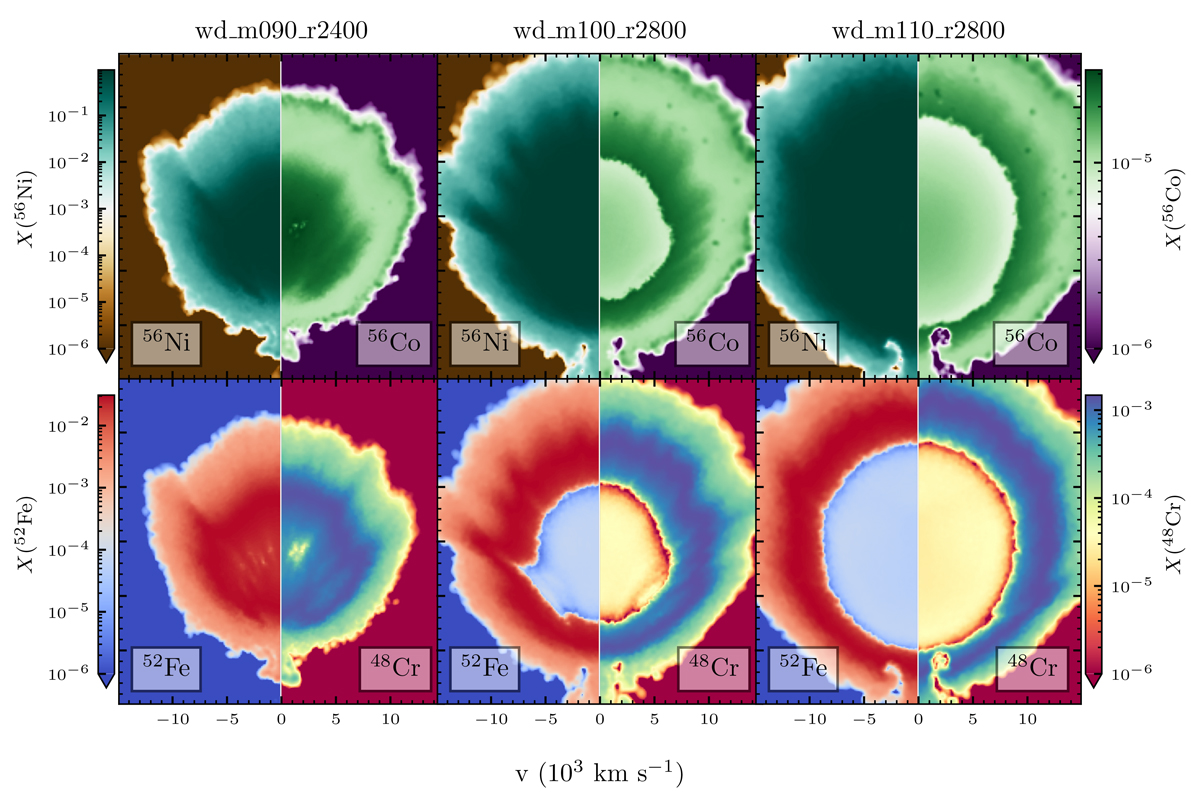
Fig. 2.
Download original image
Depiction of radioactives 100 s post-explosion for our most asymmetrically ignited modes. The slice is taken in the x-y plane. Here we illustrate the mapped normalized abundance fractions obtained from the nucleosynthetic postprocessing, as mapped to the radiative transfer simulation. Note that here we show a higher resolution than actually mapped to ARTIS.
Current usage metrics show cumulative count of Article Views (full-text article views including HTML views, PDF and ePub downloads, according to the available data) and Abstracts Views on Vision4Press platform.
Data correspond to usage on the plateform after 2015. The current usage metrics is available 48-96 hours after online publication and is updated daily on week days.
Initial download of the metrics may take a while.