Open Access
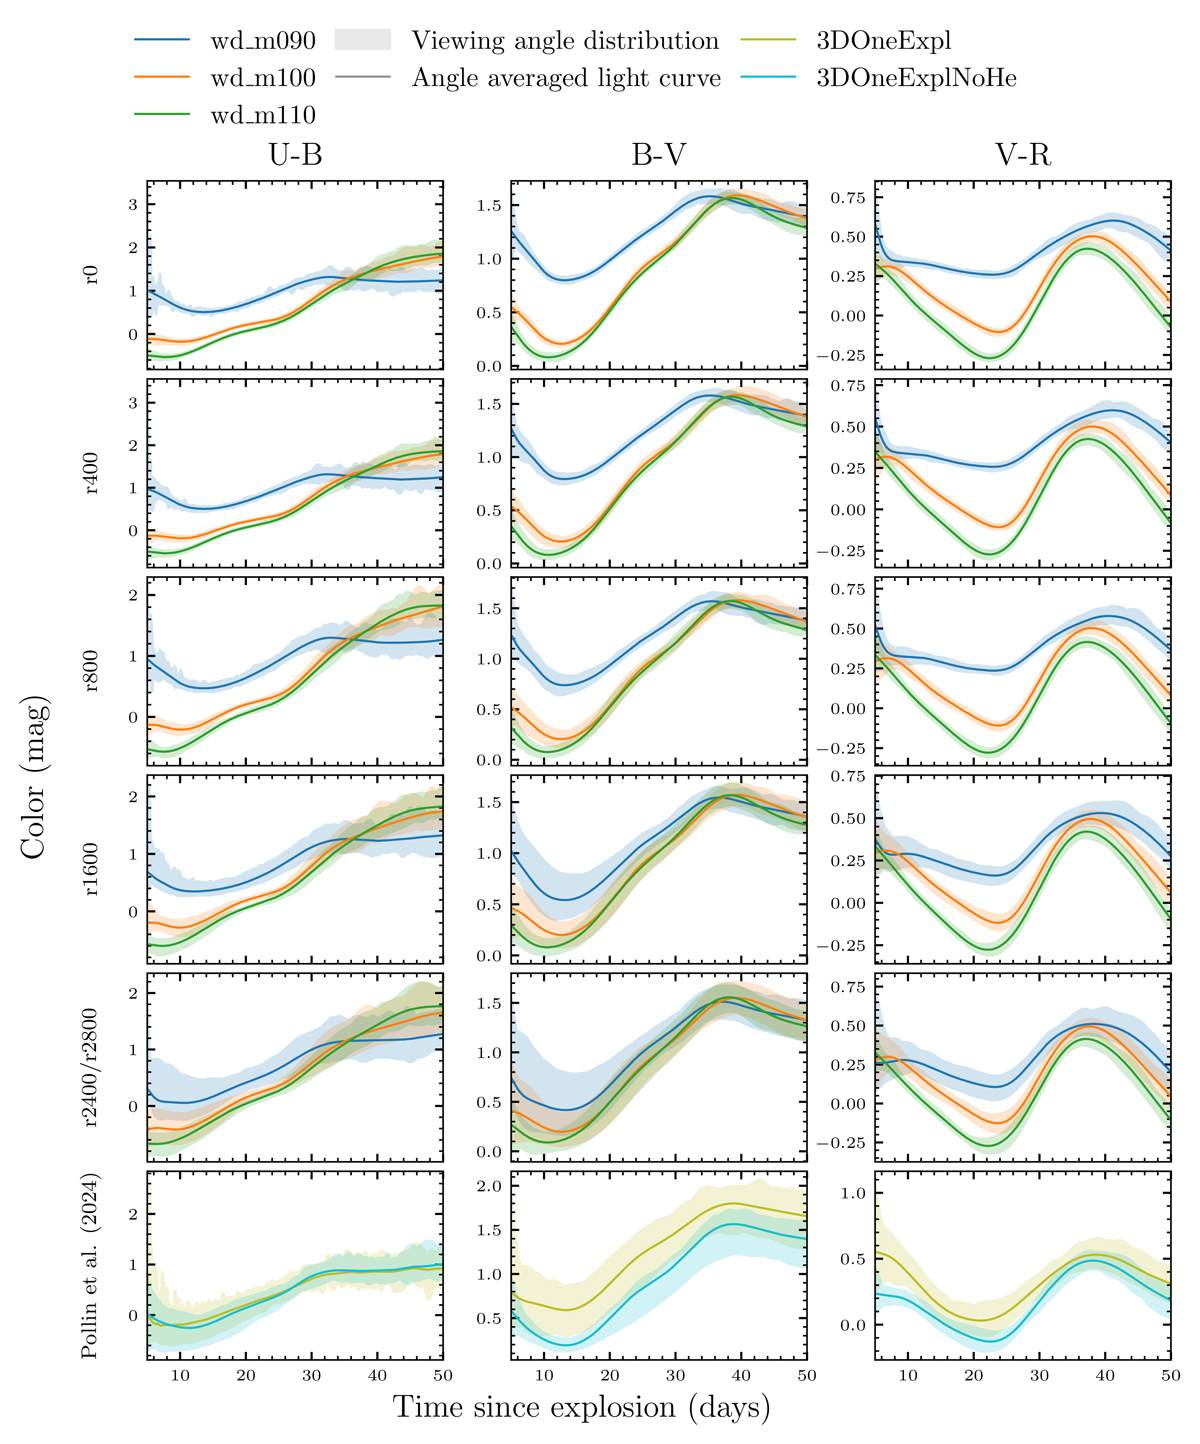
Fig. A.2.
Download original image
Same as Figure 3, but here we show the U-B, B-V, and V-R colors. In the last row, we also show the ONEEXPL and ONEEXPLNOHE model of Pollin et al. (2024) for ease of comparison.
Current usage metrics show cumulative count of Article Views (full-text article views including HTML views, PDF and ePub downloads, according to the available data) and Abstracts Views on Vision4Press platform.
Data correspond to usage on the plateform after 2015. The current usage metrics is available 48-96 hours after online publication and is updated daily on week days.
Initial download of the metrics may take a while.