Fig. 4
Download original image
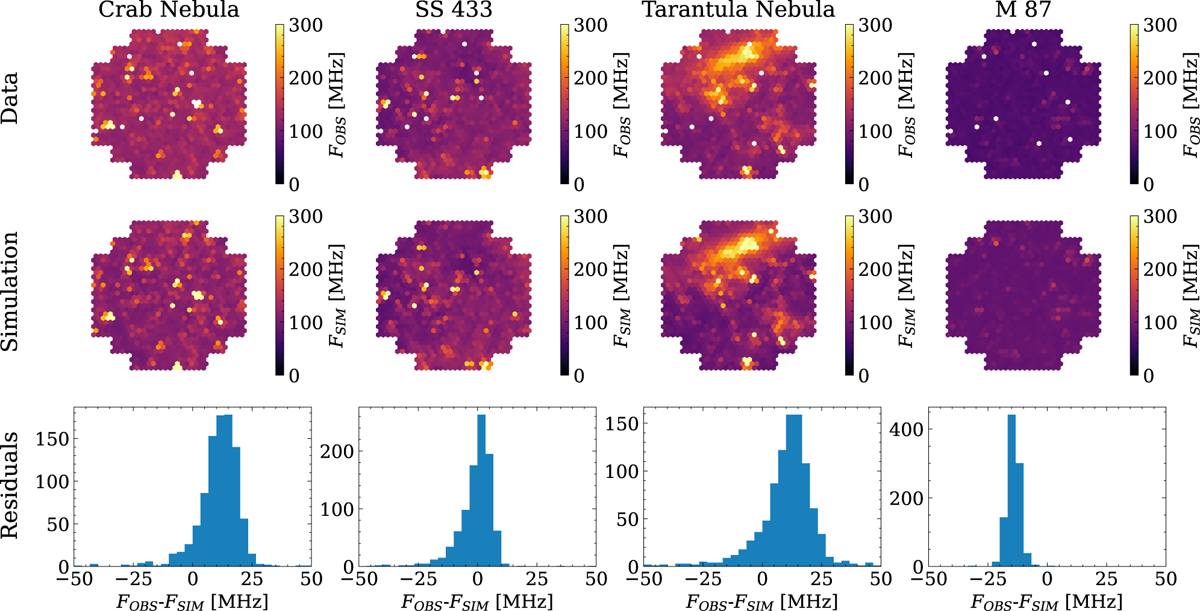
Comparison between NSB measurements and simulation for the Crab nebula, SS 433, Tarantula nebula, and M 87. The upper row displays the data corrected for flatfielding, the middle row displays the simulated data, and the bottom row displays the pixel-wise residuals in MHz. White pixels in the top row indicate that this specific pixel was disabled at the time of data acquisition.
Current usage metrics show cumulative count of Article Views (full-text article views including HTML views, PDF and ePub downloads, according to the available data) and Abstracts Views on Vision4Press platform.
Data correspond to usage on the plateform after 2015. The current usage metrics is available 48-96 hours after online publication and is updated daily on week days.
Initial download of the metrics may take a while.