Fig. 1
Download original image
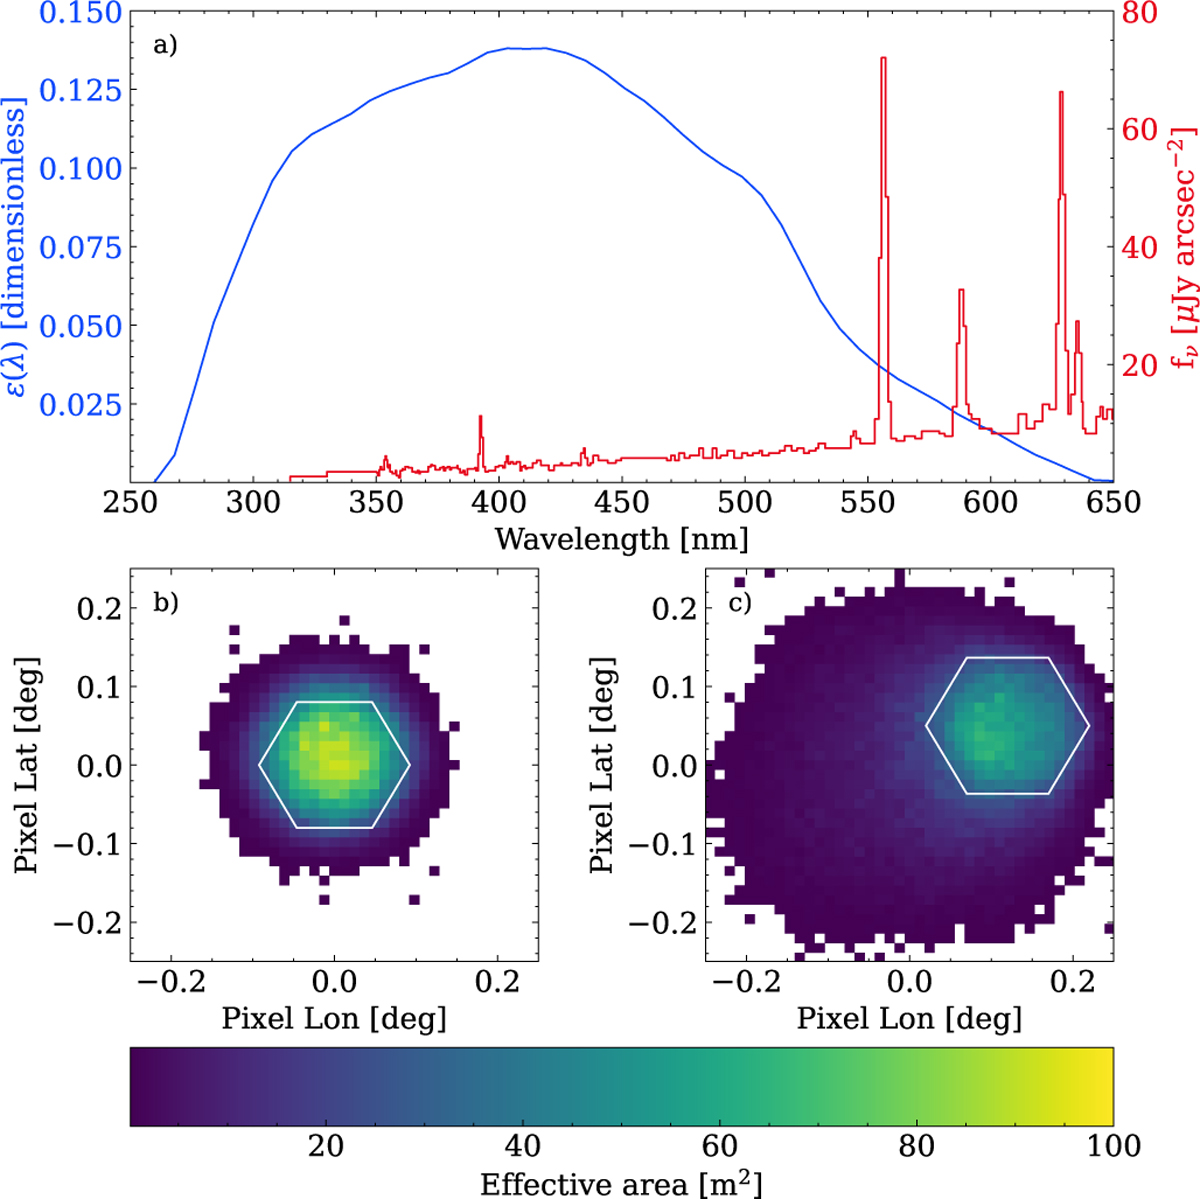
Assumed instrumental response for the individual H.E.S.S. I telescopes. (a) indicates the total bandpass, where ɛ(λ) is defined as the ratio between detected and incident photons. For comparison, the night sky spectrum from Benn & Ellison (1998) is shown in red. (b) indicates the effective area for a pixel close to the optical axis. (c) indicates the effective area for an off-axis pixel. This suggests noticeable asymmetry due to optical aberrations. The white hexagons in (b) and (c) indicate the pixel size when projected onto the reference frame of the telescope.
Current usage metrics show cumulative count of Article Views (full-text article views including HTML views, PDF and ePub downloads, according to the available data) and Abstracts Views on Vision4Press platform.
Data correspond to usage on the plateform after 2015. The current usage metrics is available 48-96 hours after online publication and is updated daily on week days.
Initial download of the metrics may take a while.