Open Access
Fig. 5.
Download original image
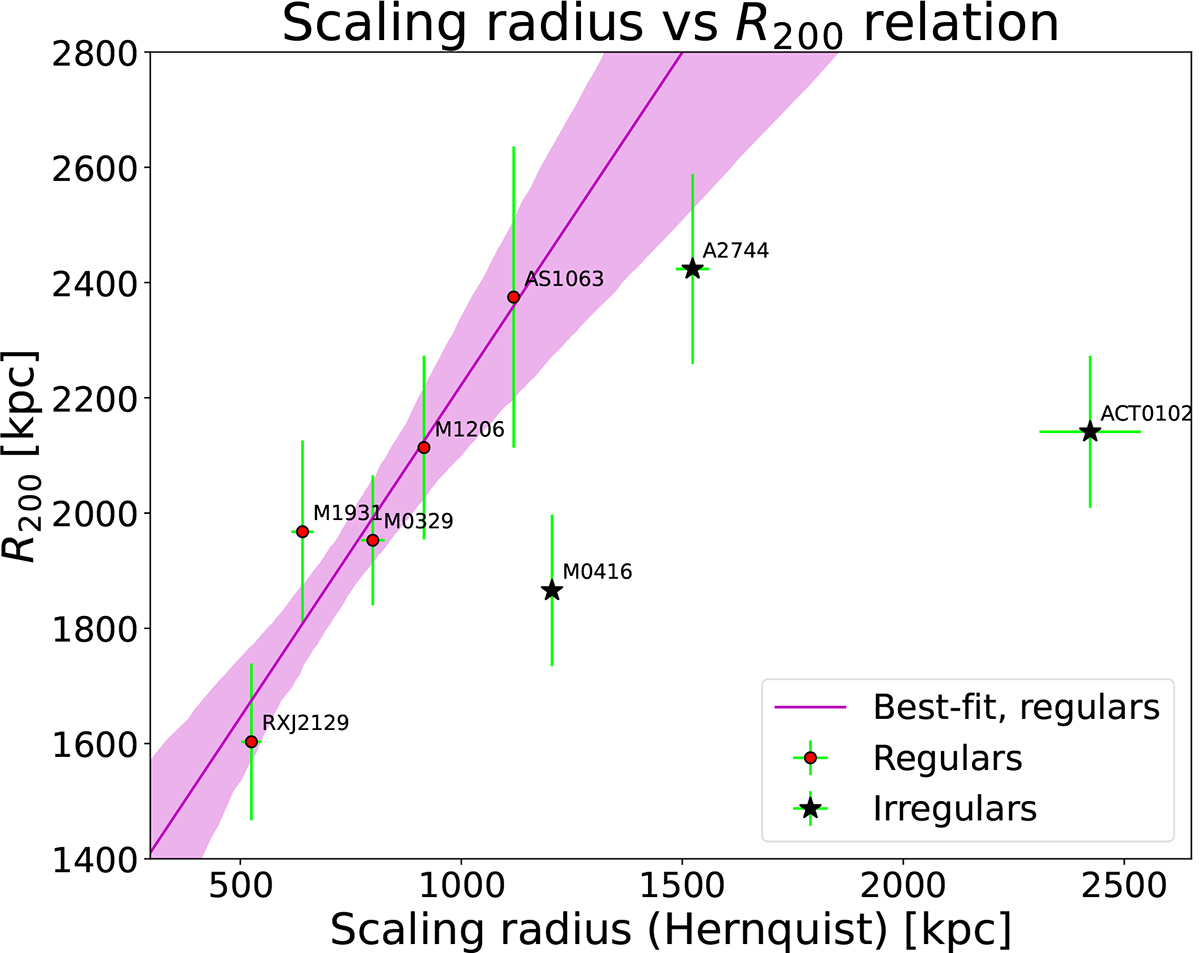
Relation between the fitted scale radii of the Hernquist profile, rs, and the R200c values obtained from the available values of M200c. The solid line shows the linear best fit, and its corresponding 1σ uncertainty is represented by the shaded zone.
Current usage metrics show cumulative count of Article Views (full-text article views including HTML views, PDF and ePub downloads, according to the available data) and Abstracts Views on Vision4Press platform.
Data correspond to usage on the plateform after 2015. The current usage metrics is available 48-96 hours after online publication and is updated daily on week days.
Initial download of the metrics may take a while.