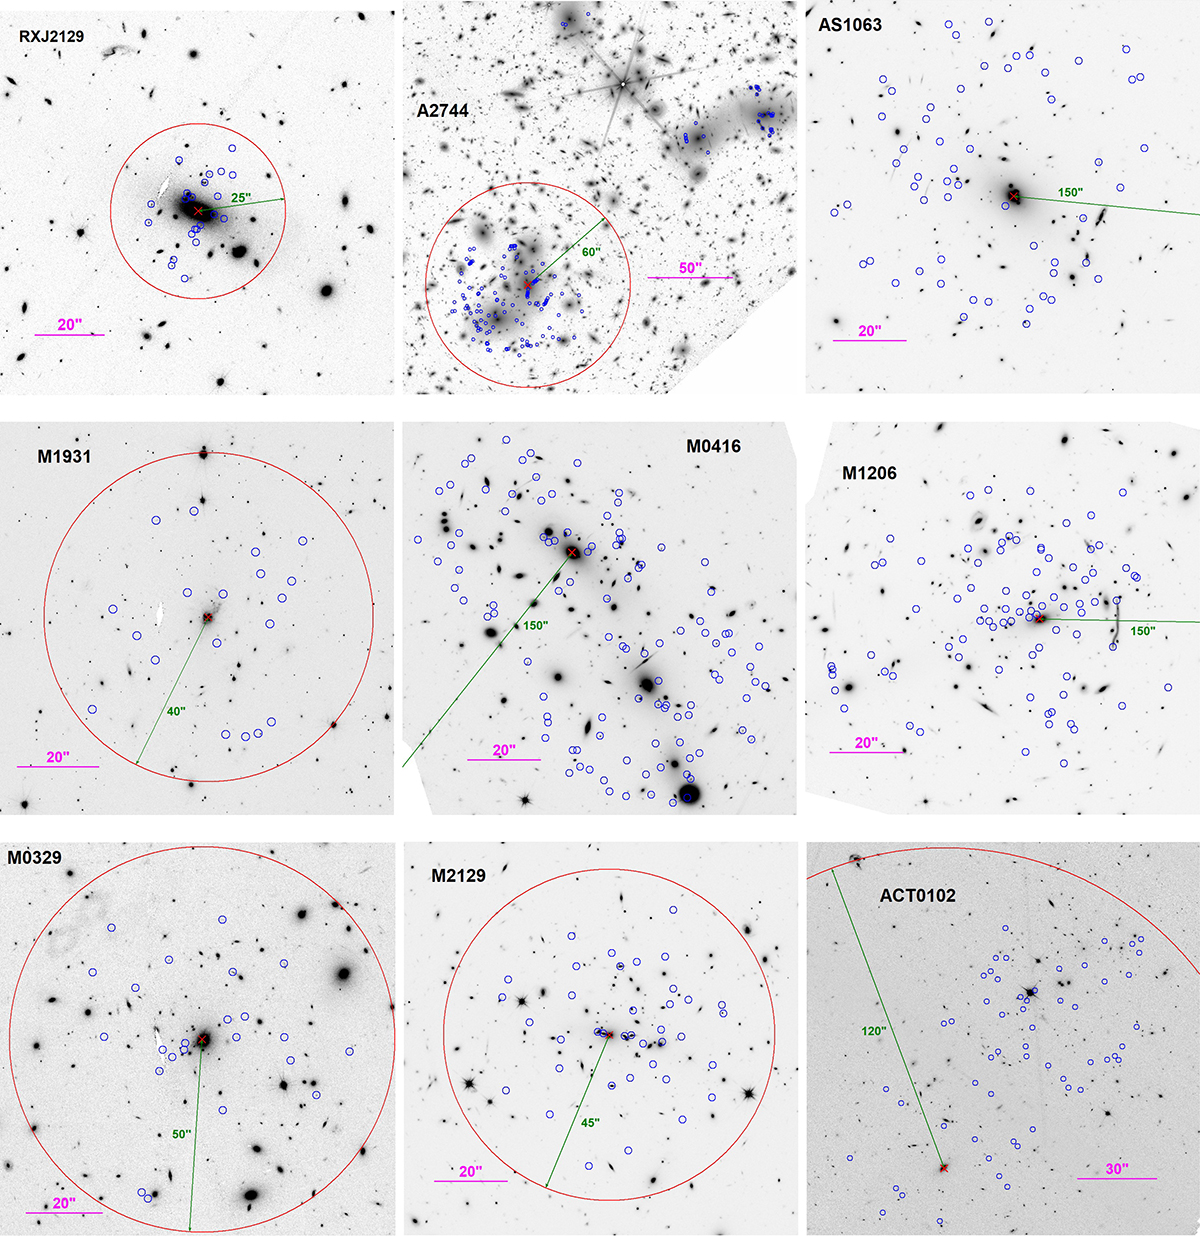
Fig. 1.
Download original image
The galaxy clusters of our sample. The background images are from the HST and JWST optical/infrared passbands. The blue circles represent the positions of the multiple images employed in the strong-lensing studies by Caminha et al. (2019, 2023) and Bergamini et al. (2019, 2023). The red circles show the area surrounding the multiple images that we considered for the measurement of the projected total mass profiles. The red crosses indicate the centers of the red circles and the origin point of each projected total mass profile. The green lines represent the radii of the red circles, whose length is shown near them.
Current usage metrics show cumulative count of Article Views (full-text article views including HTML views, PDF and ePub downloads, according to the available data) and Abstracts Views on Vision4Press platform.
Data correspond to usage on the plateform after 2015. The current usage metrics is available 48-96 hours after online publication and is updated daily on week days.
Initial download of the metrics may take a while.