Fig. 5.
Download original image
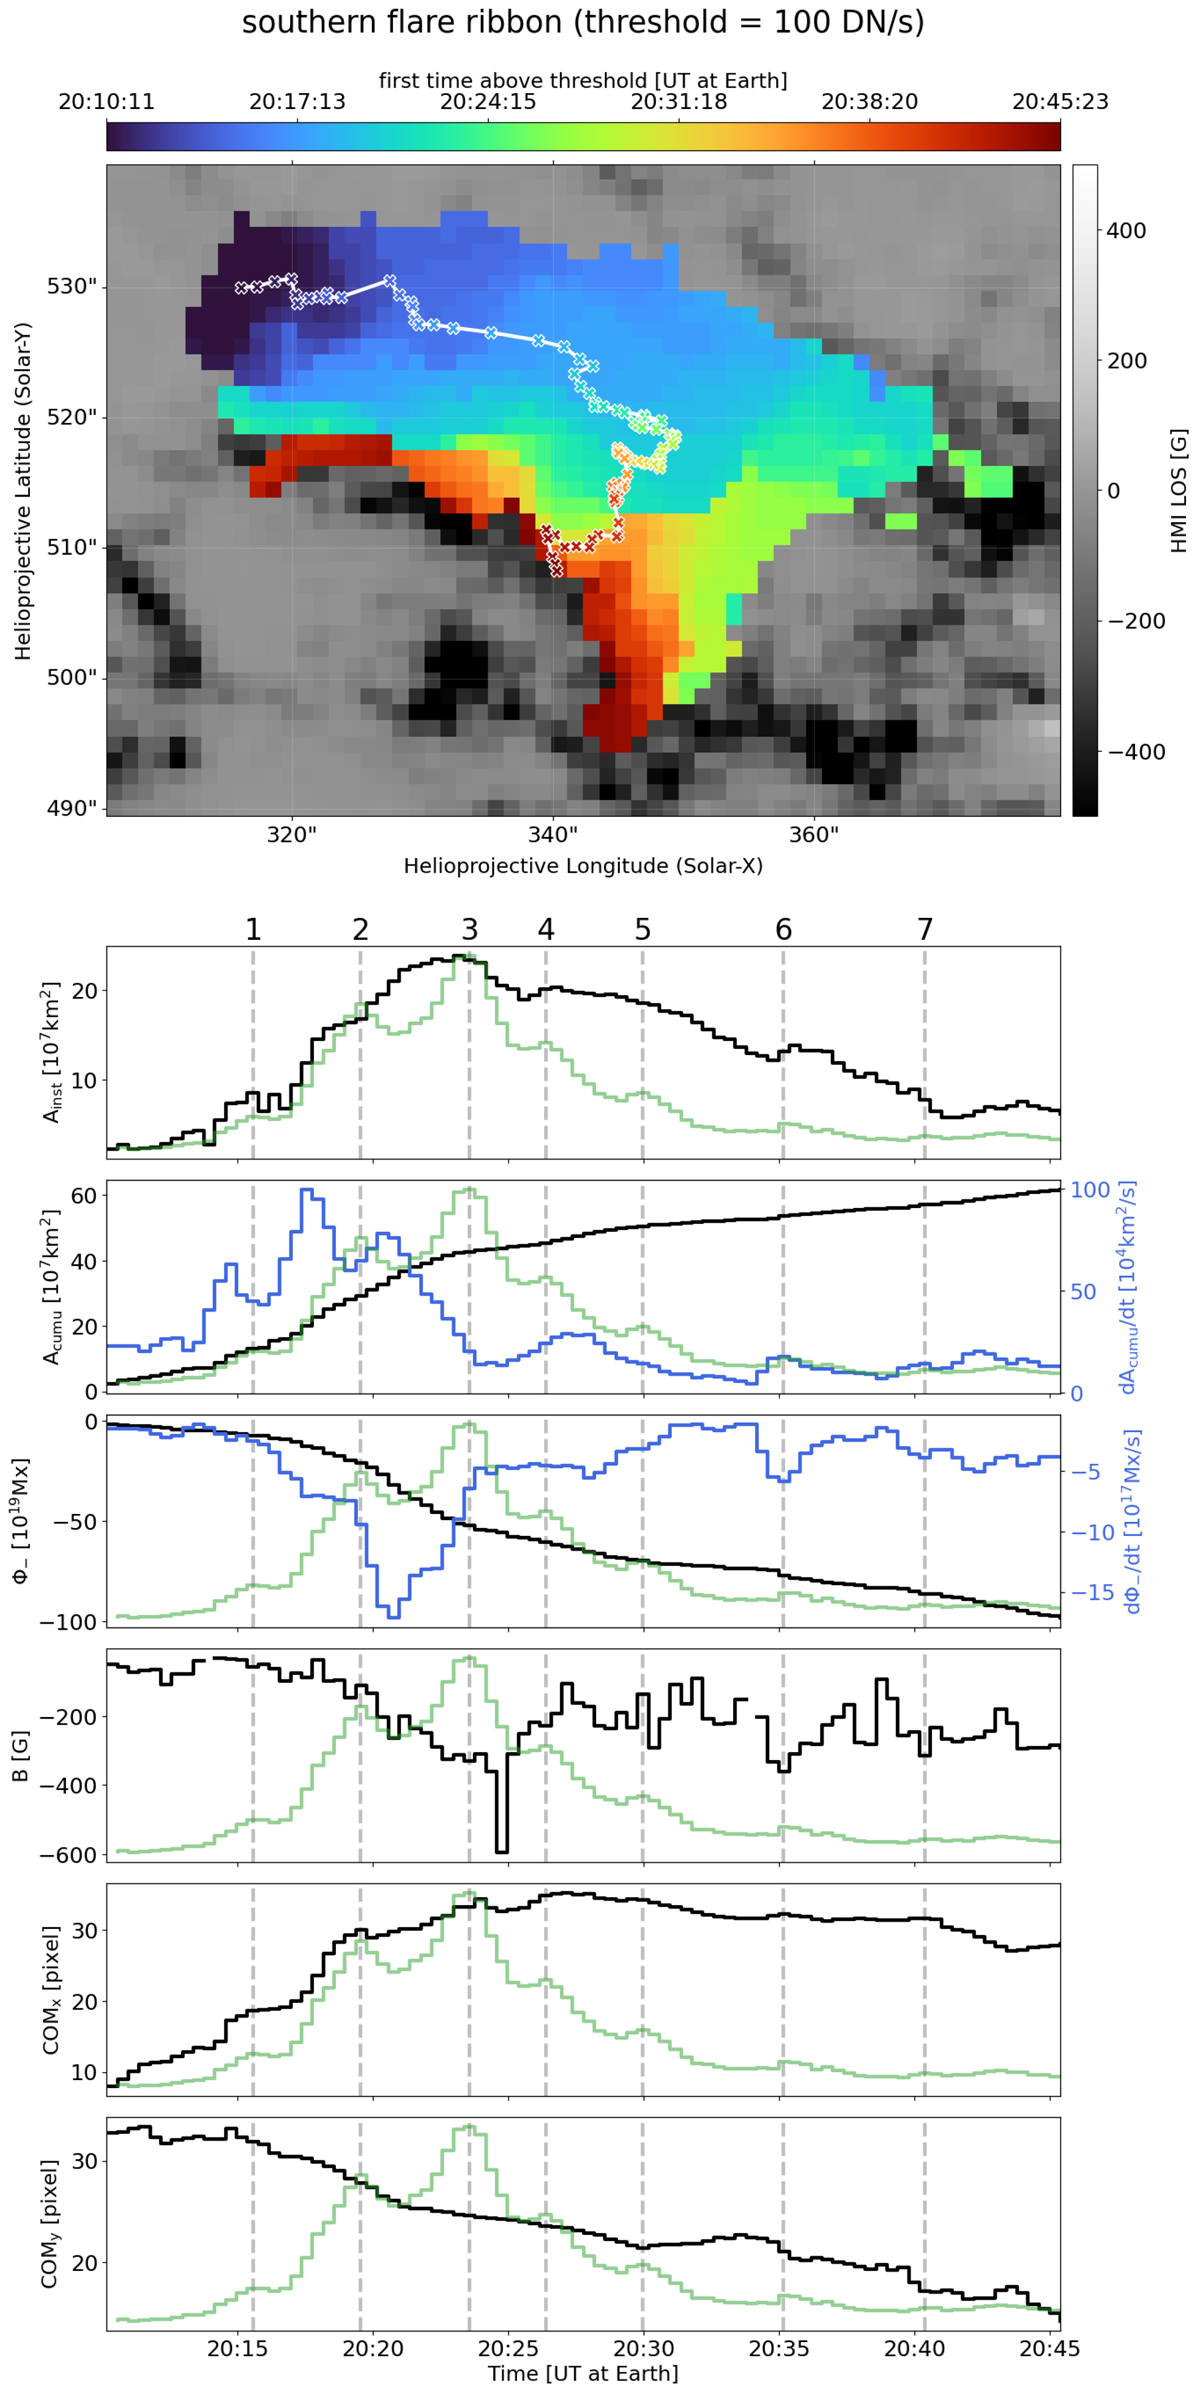
Spatiotemporal evolution of the AIA 1600 Å emission in the southern flare ribbon subarea introduced in Fig. 4 and derived parameters. Top panel: Pixels are colored according to the time at which they first exceeded the set threshold (100 DN/S) during the time interval indicated on the color bar. The total extent of the colored area corresponds to the final cumulative mask. The background shows the magnetic flux density according to the HMI LOS magnetogram recorded at the beginning of the time interval. The center of mass (COM) within the instantaneous mask of each time step is marked (X). Bottom panels: Time series of parameters derived from the mask evolution and the HMI LOS magnetogram shown. From top to bottom: The total area of the instantaneous mask (Ainst), the total area of the cumulative mask (Acumu), the total flux within the cumulative mask (Φ+ or Φ− depending on the main polarity of the subregion), the mean magnetic flux density in newly added pixels (B), and the x and y coordinates of the COM. Smoothed derivatives of selected parameters are shown in blue. The STIX 15–25 keV light curve (green) is shown as a reference, and peak times of the HXR pulsations are marked by dashed lines and numbered at the top. Associated movie is available online.
Current usage metrics show cumulative count of Article Views (full-text article views including HTML views, PDF and ePub downloads, according to the available data) and Abstracts Views on Vision4Press platform.
Data correspond to usage on the plateform after 2015. The current usage metrics is available 48-96 hours after online publication and is updated daily on week days.
Initial download of the metrics may take a while.