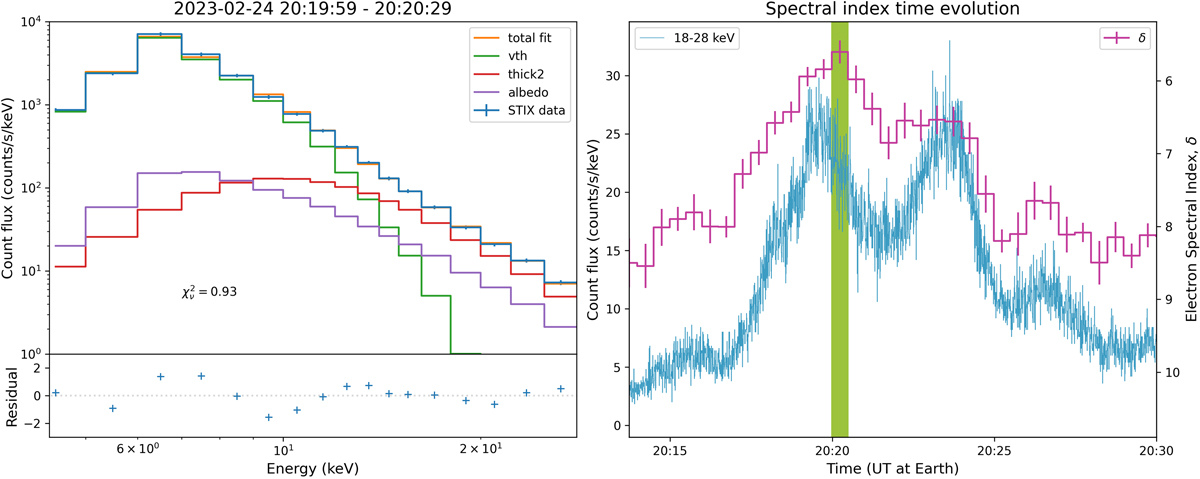
Fig. 2.
Download original image
Left: STIX spectrum (blue) fitted with a thermal (vth; green) and a non-thermal (thick2; red) model and an albedo component. Right: Time evolution of the electron spectral index (δ; magenta) derived from a sequence of STIX spectra binned to 30 second intervals and counts in the STIX 18–28 keV energy band (blue). Time interval corresponding to the spectrum (left panel) is marked.
Current usage metrics show cumulative count of Article Views (full-text article views including HTML views, PDF and ePub downloads, according to the available data) and Abstracts Views on Vision4Press platform.
Data correspond to usage on the plateform after 2015. The current usage metrics is available 48-96 hours after online publication and is updated daily on week days.
Initial download of the metrics may take a while.