Fig. 1.
Download original image
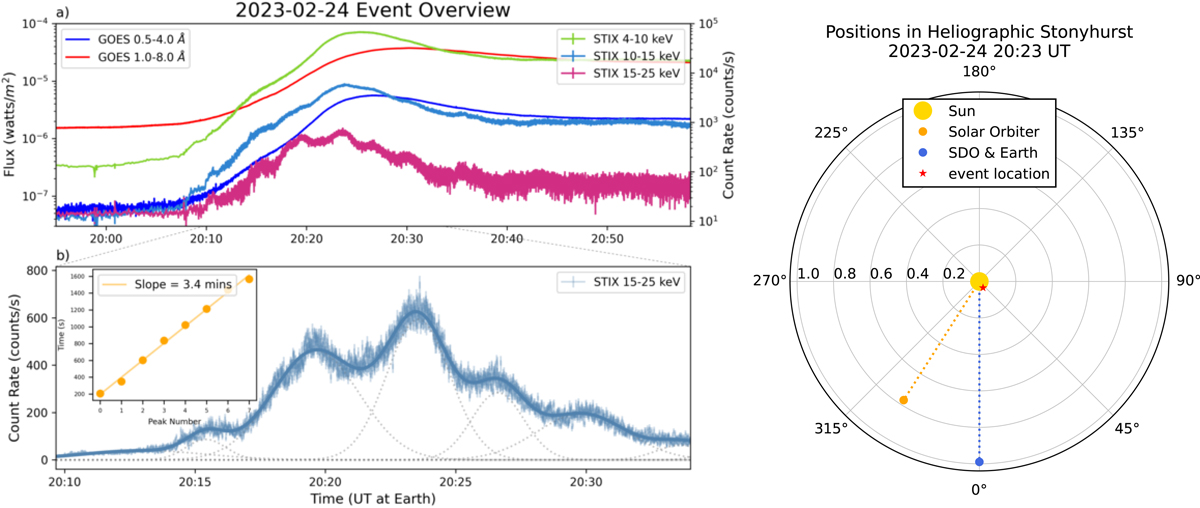
Event overview. Panel a: GOES/XRS and STIX X-ray light curves in multiple energy bands during the flare. Panel b: Shorter time interval, focusing on the pulsations in the STIX 15–25 keV energy band (blue). The observations are fitted by the linear combination (blue) of a series of individual Gaussians (dotted, gray). Right: Spacecraft positions during the event in heliographic stonyhurst coordinates. The position of the main flare loop arcade is marked (red start).
Current usage metrics show cumulative count of Article Views (full-text article views including HTML views, PDF and ePub downloads, according to the available data) and Abstracts Views on Vision4Press platform.
Data correspond to usage on the plateform after 2015. The current usage metrics is available 48-96 hours after online publication and is updated daily on week days.
Initial download of the metrics may take a while.