Fig. 3
Download original image
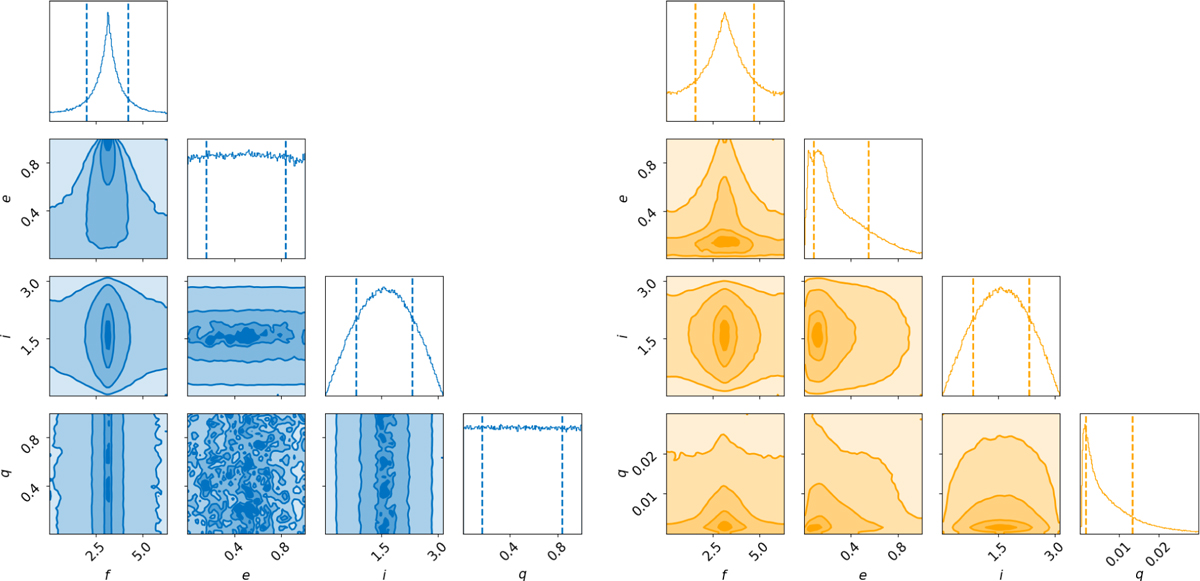
Statistical properties of the samples. Left panel: corner plot distribution of the binary sample we generated for the variables f, e, i, and q for the binary population. Right panel: same as in the left panel, but for the planet population. We deliberately omitted ![]() because for the binary and planet populations, the longitude of the pericentre ϖ is sampled from a uniform distribution between 0 < ϖ < 2 π. The vertical dashed lines represent intervals containing 16% and 84% of the sample (2σ).
because for the binary and planet populations, the longitude of the pericentre ϖ is sampled from a uniform distribution between 0 < ϖ < 2 π. The vertical dashed lines represent intervals containing 16% and 84% of the sample (2σ).
Current usage metrics show cumulative count of Article Views (full-text article views including HTML views, PDF and ePub downloads, according to the available data) and Abstracts Views on Vision4Press platform.
Data correspond to usage on the plateform after 2015. The current usage metrics is available 48-96 hours after online publication and is updated daily on week days.
Initial download of the metrics may take a while.