Fig. 9.
Download original image
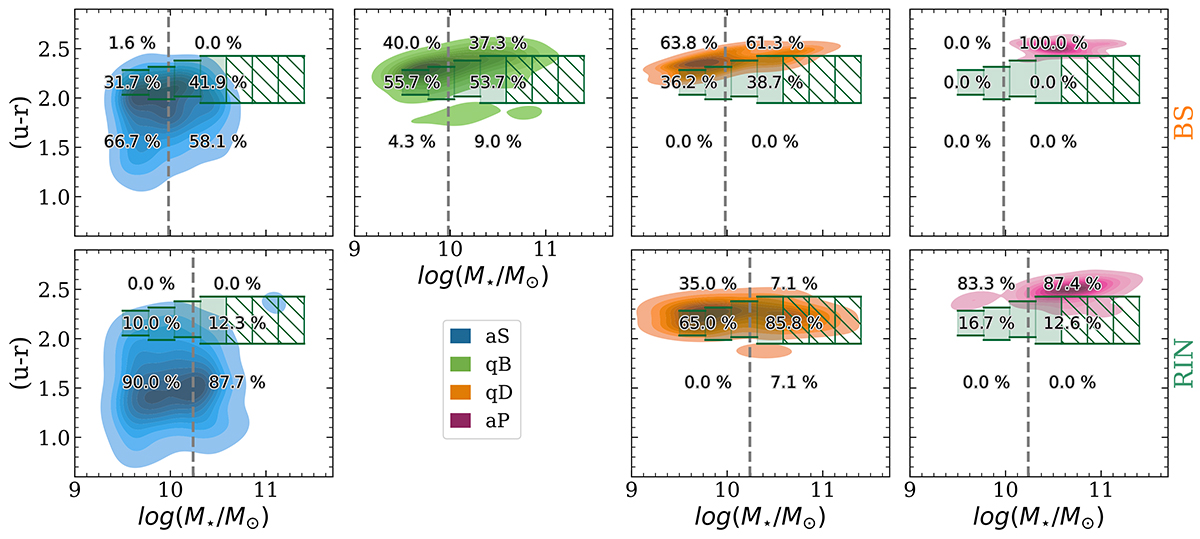
(u − r) colour-stellar mass diagram at z = 0 for the each BS and RIN sub-types. Upper panels: BS galaxy sub-types are presented from left to right: aS, qB, qD, and aP. The dashed grey vertical line marks the median log(M⋆/M⊙) = 9.98 for the BS galaxy sample, dividing the low- and high-mass bins. Lower panels: RIN galaxy sub-types are displayed from left to right: aS, qD, and aP. Here, the dashed grey line corresponds to log(M⋆/M⊙) = 10.24. In all panels, colours indicate galaxy number density, ranging from lighter (lower density) to darker (higher density) shades. The shaded green region highlights the GV, while the hatched area marks the GZ as defined in this work. Percentages shown in the plots indicate the fractions of blue (bottom), green (middle), and red (top) galaxies within the low- and high-mass bins.
Current usage metrics show cumulative count of Article Views (full-text article views including HTML views, PDF and ePub downloads, according to the available data) and Abstracts Views on Vision4Press platform.
Data correspond to usage on the plateform after 2015. The current usage metrics is available 48-96 hours after online publication and is updated daily on week days.
Initial download of the metrics may take a while.