Fig. 7.
Download original image
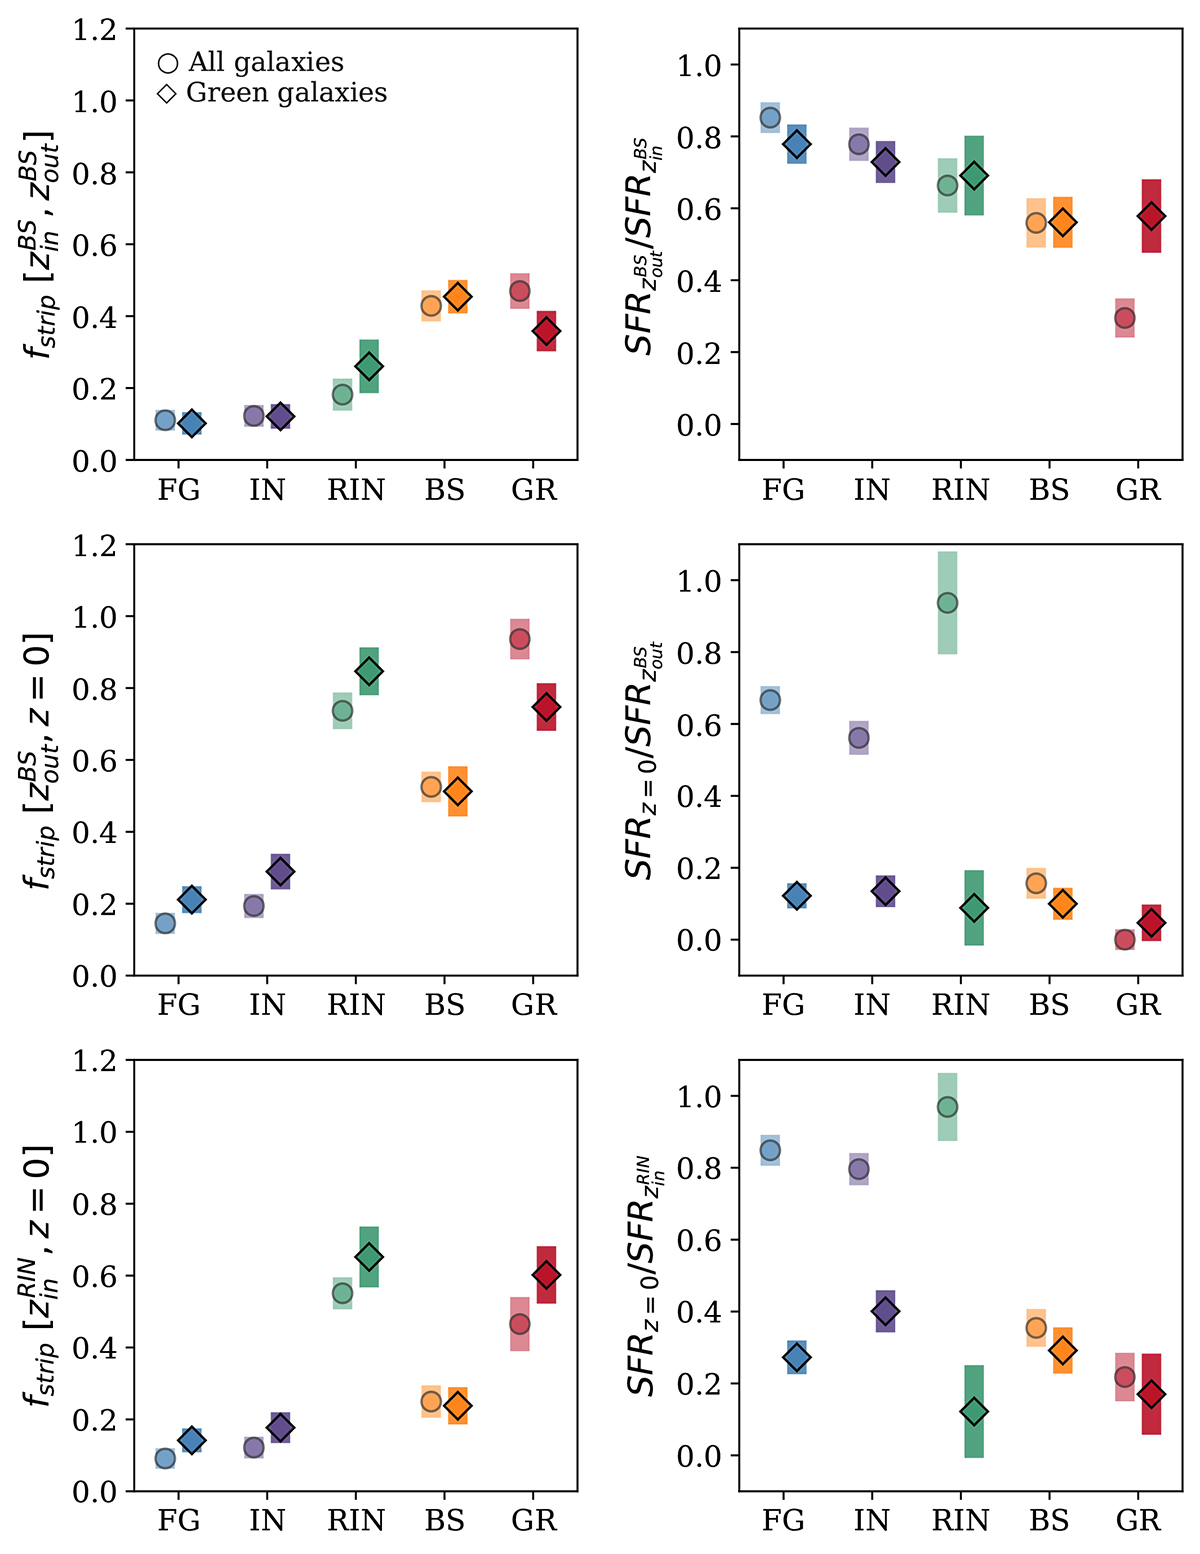
Upper panels: Fraction of mass stripped (left) and SFR ratio (right) during the median diving interval for BSs. Middle panels: Fraction of mass stripped (left) and SFR ratio (right) during the median backsplash time for BSs. Lower panels: Fraction of mass stripped (left) and SFR ratio (right) during the median time interval for RINs within the group. Results are presented for FGs and the four defined types of system galaxies. The values shown represent the median and standard deviation, calculated using the bootstrap method. Circles indicate the total number of galaxies of each type, while diamonds represent only the green galaxies of each type. We recall that in Fig. 5, ![]() ,
, ![]() , and
, and ![]() .
.
Current usage metrics show cumulative count of Article Views (full-text article views including HTML views, PDF and ePub downloads, according to the available data) and Abstracts Views on Vision4Press platform.
Data correspond to usage on the plateform after 2015. The current usage metrics is available 48-96 hours after online publication and is updated daily on week days.
Initial download of the metrics may take a while.