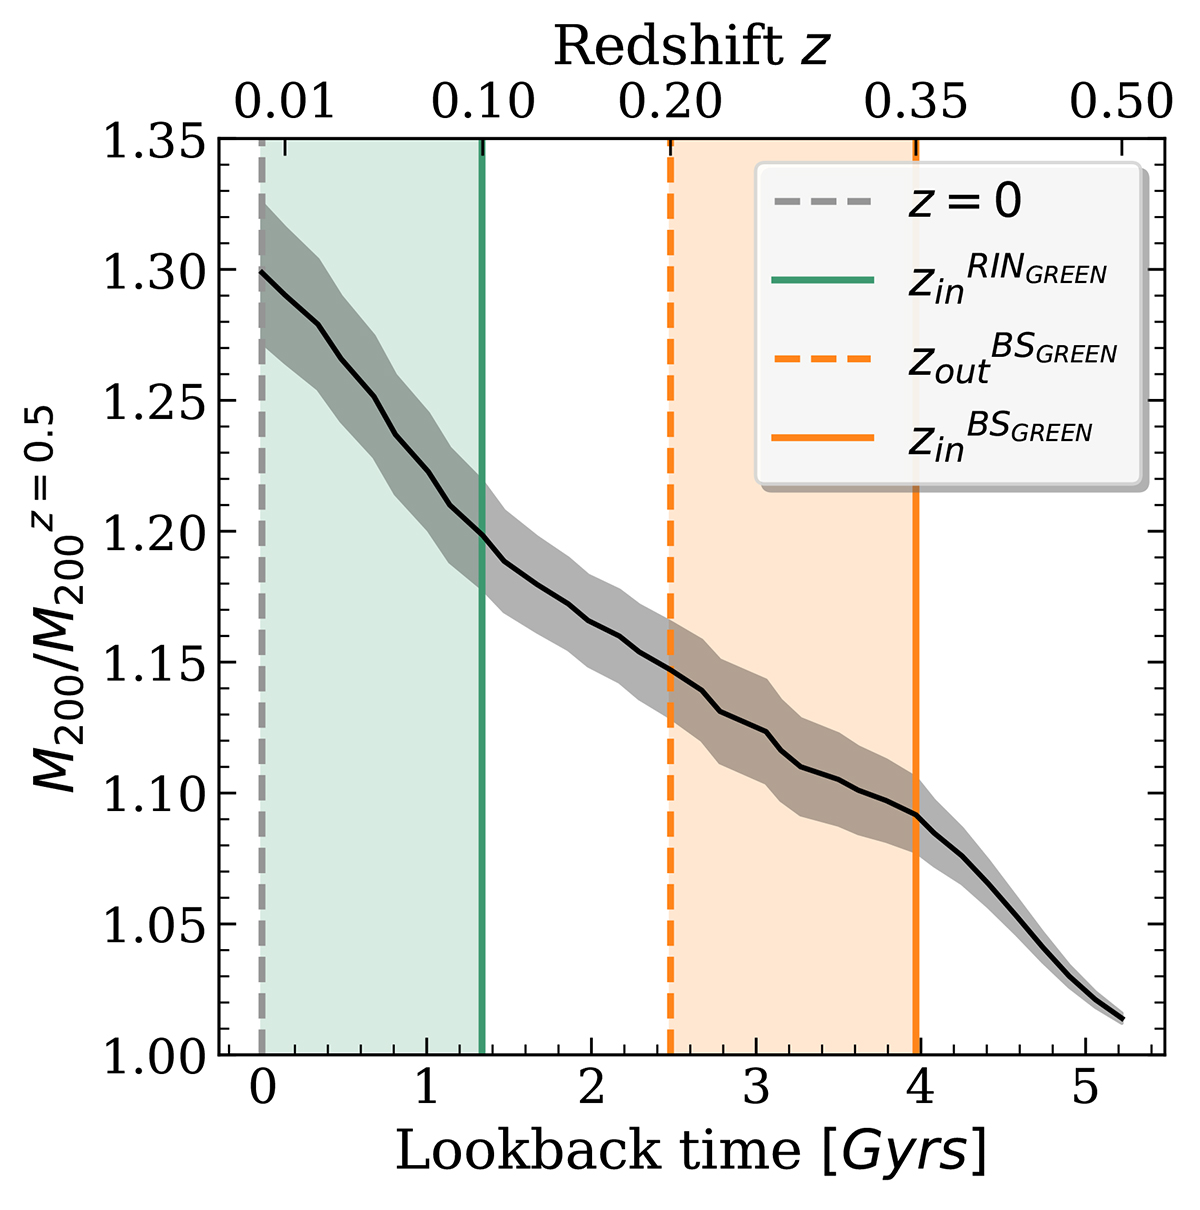
Fig. 6.
Download original image
Median evolution of the M200 value for the 214 FoF groups in our sample, normalised to its value at z = 0.5. The grey shaded regions represent error bars derived from bootstrap resampling. The orange vertical lines indicate the median ongoing (solid line) and outgoing (dashed line) crossing times of R200 for green BSs. The green solid vertical line represents the median group ongoing time for green RINs. The grey dashed line marks z = 0. The orange shaded region denotes the diving stage for green BSs, while the green shaded area highlights the diving stage for green RINs.
Current usage metrics show cumulative count of Article Views (full-text article views including HTML views, PDF and ePub downloads, according to the available data) and Abstracts Views on Vision4Press platform.
Data correspond to usage on the plateform after 2015. The current usage metrics is available 48-96 hours after online publication and is updated daily on week days.
Initial download of the metrics may take a while.