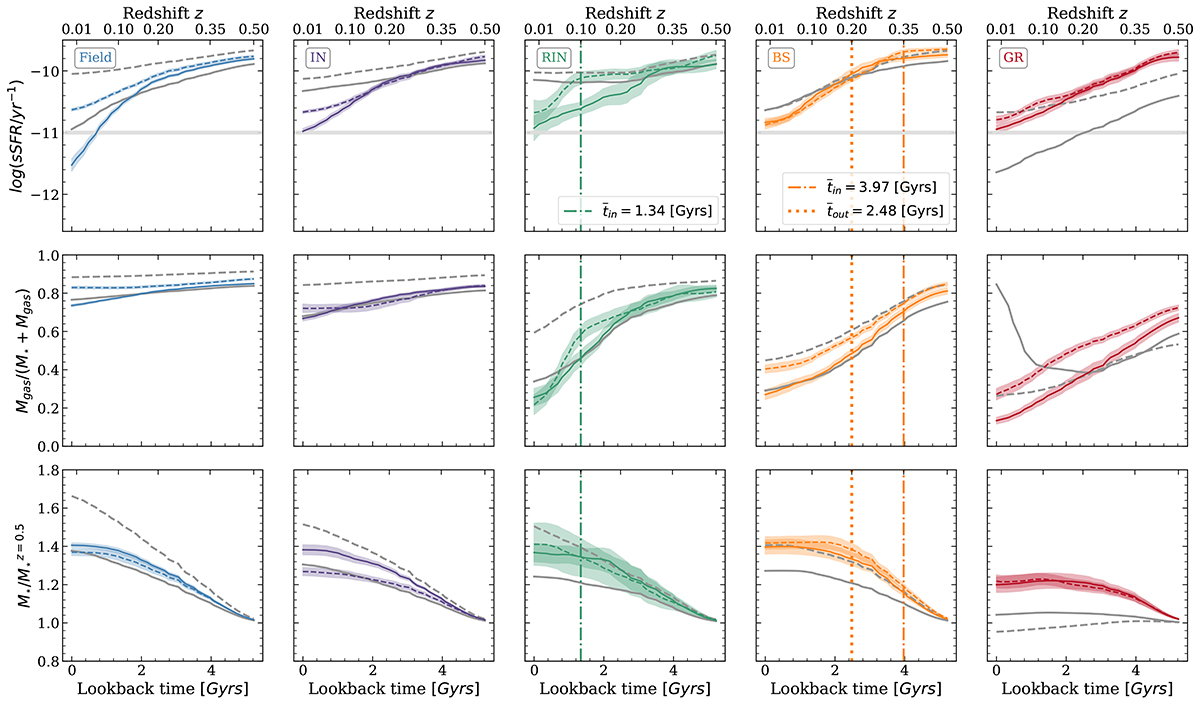
Fig. 5.
Download original image
Evolution of green galaxies from z = 0.5 to z = 0 for the five classes analysed in this work. The panels display, from top to bottom: median values of the sSFR, the gas fraction relative to M⋆ + Mgas, and the stellar mass normalised to its value at z = 0.5. Solid and dashed lines represent the trends for high- and low-mass galaxies, respectively, separated by the median stellar mass of the random sample. Shaded regions indicate error bars derived through bootstrap resampling. For comparison, we show in grey the behaviour of the total sample for each class, considering not only green galaxies but also blue and red galaxies. In the RIN class panel, the vertical line indicates the median entry time of green RINs into the group’s virial region, whereas in the BS class panel, vertical lines mark the median entry and exit times of green BSs from the group’s R200. The horizontal light grey line indicates the threshold for classifying galaxies as SF or PS.
Current usage metrics show cumulative count of Article Views (full-text article views including HTML views, PDF and ePub downloads, according to the available data) and Abstracts Views on Vision4Press platform.
Data correspond to usage on the plateform after 2015. The current usage metrics is available 48-96 hours after online publication and is updated daily on week days.
Initial download of the metrics may take a while.