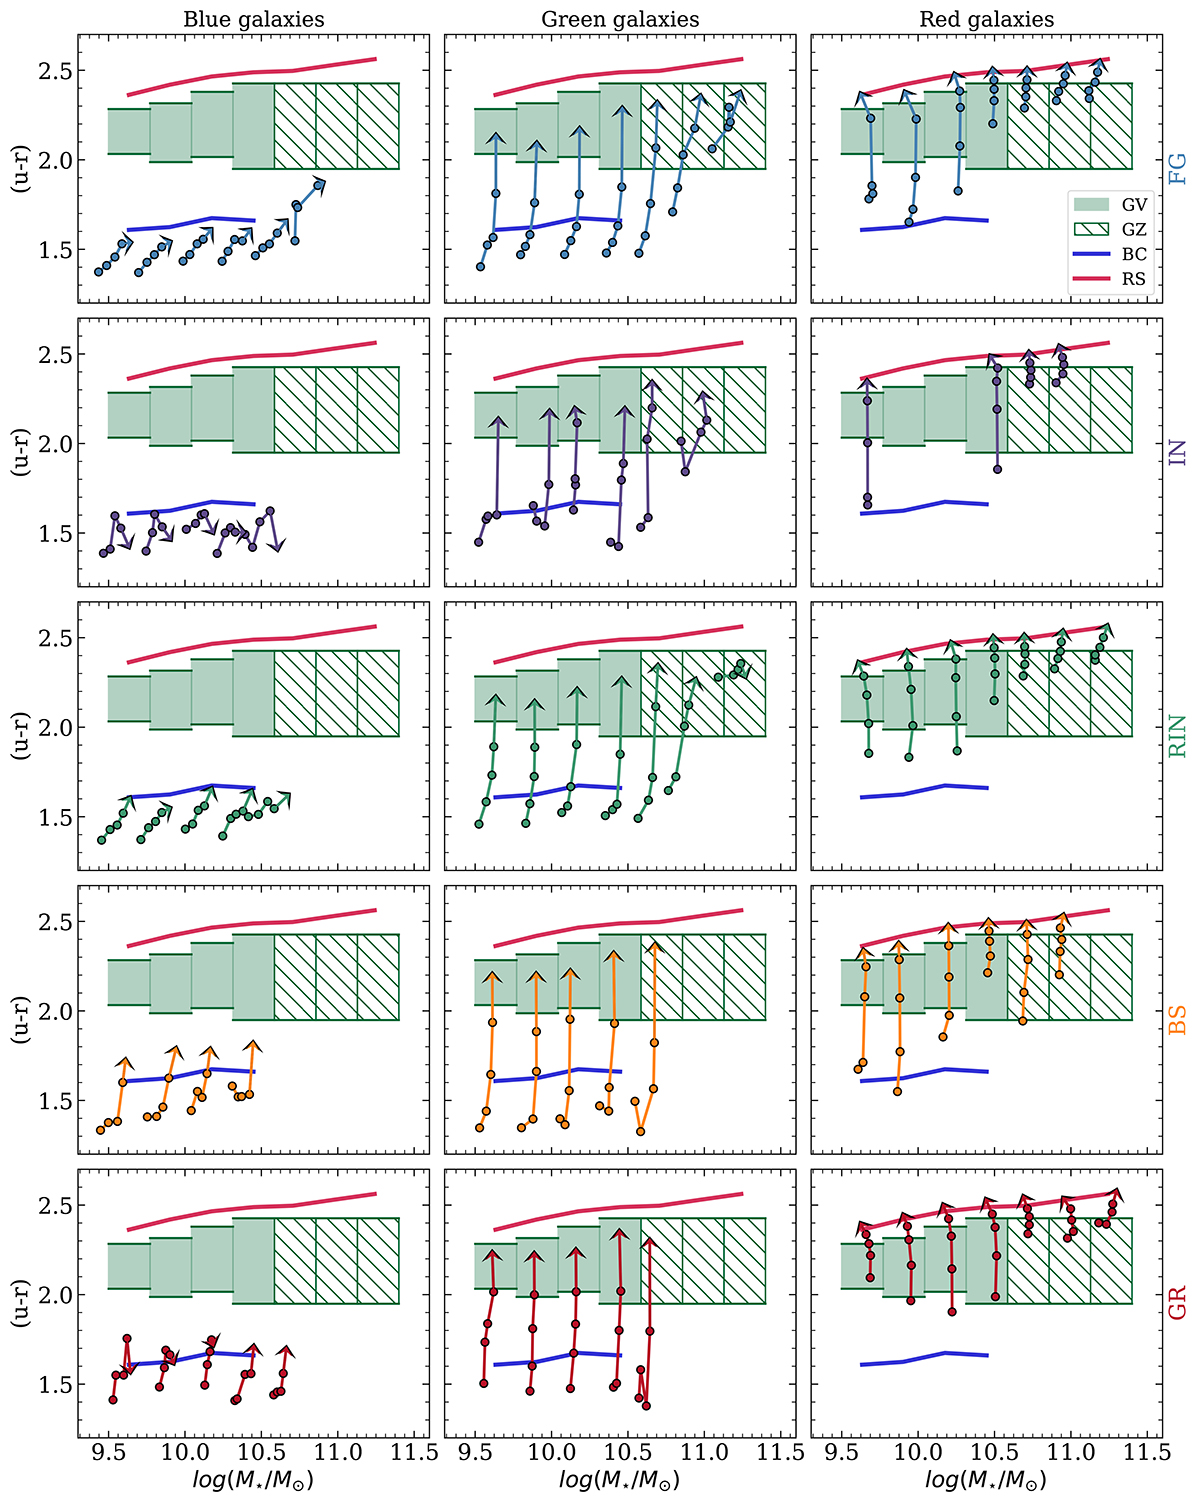
Fig. 3.
Download original image
Evolutionary tracks in the (u − r) colour versus stellar mass diagram for galaxies classified as blue (left column), green (middle column), and red (right column) at z = 0. The position of the arrow tips indicates the median location of galaxies at z = 0 for each stellar mass bin used to define the GV and the GZ in Sect. 3. The circles track the median positions of galaxies in the diagram at previous redshifts z = 0.1 (t = 1.34 Gyr), z = 0.2 (t = 2.48 Gyr), z = 0.3 (t = 3.50 Gyr) and z = 0.4 (t = 4.41 Gyr) for each bin. The shaded region represents the GV, while the hatched area marks the GZ. The blue and red lines represent the mean colour of BC and RS, respectively. Results are presented for FGs (first row), INs (second row), RINs (third row), BSs (fourth row), and GRs (fifth row).
Current usage metrics show cumulative count of Article Views (full-text article views including HTML views, PDF and ePub downloads, according to the available data) and Abstracts Views on Vision4Press platform.
Data correspond to usage on the plateform after 2015. The current usage metrics is available 48-96 hours after online publication and is updated daily on week days.
Initial download of the metrics may take a while.