Fig. 2.
Download original image
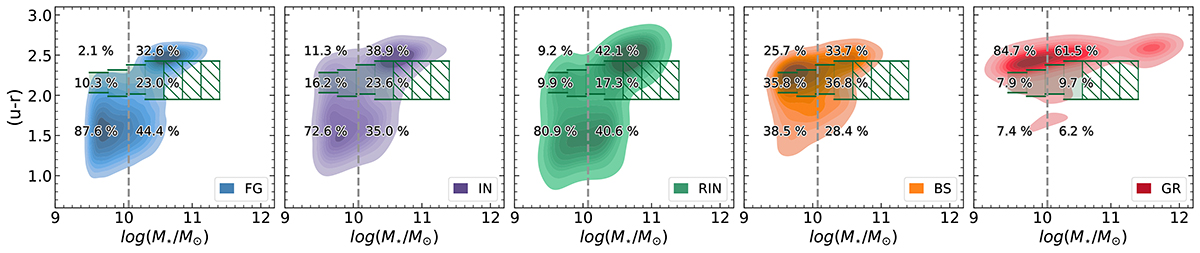
(u − r) colour-stellar mass diagram at z = 0 for each galaxy class. From left to right, the panels correspond to FGs, INs, RINs, BSs, and GRs, respectively. In these panels, different colours correspond to different galaxy number density, ranging from the lowest (lighter colours) to the highest (darker colours) values in each case. In each plot, the shaded region indicates the GV, while the hatched area marks the GZ. The dashed gray vertical line denotes the median log(M⋆/M⊙) = 10.07 for our random sample independent of the environment, delimiting the low- and high-mass galaxies. The percentages indicated on the plots represent the fractions of blue (bottom), green (middle), and red (top) galaxies in the low and high stellar mass sub-sample.
Current usage metrics show cumulative count of Article Views (full-text article views including HTML views, PDF and ePub downloads, according to the available data) and Abstracts Views on Vision4Press platform.
Data correspond to usage on the plateform after 2015. The current usage metrics is available 48-96 hours after online publication and is updated daily on week days.
Initial download of the metrics may take a while.