Fig. 12.
Download original image
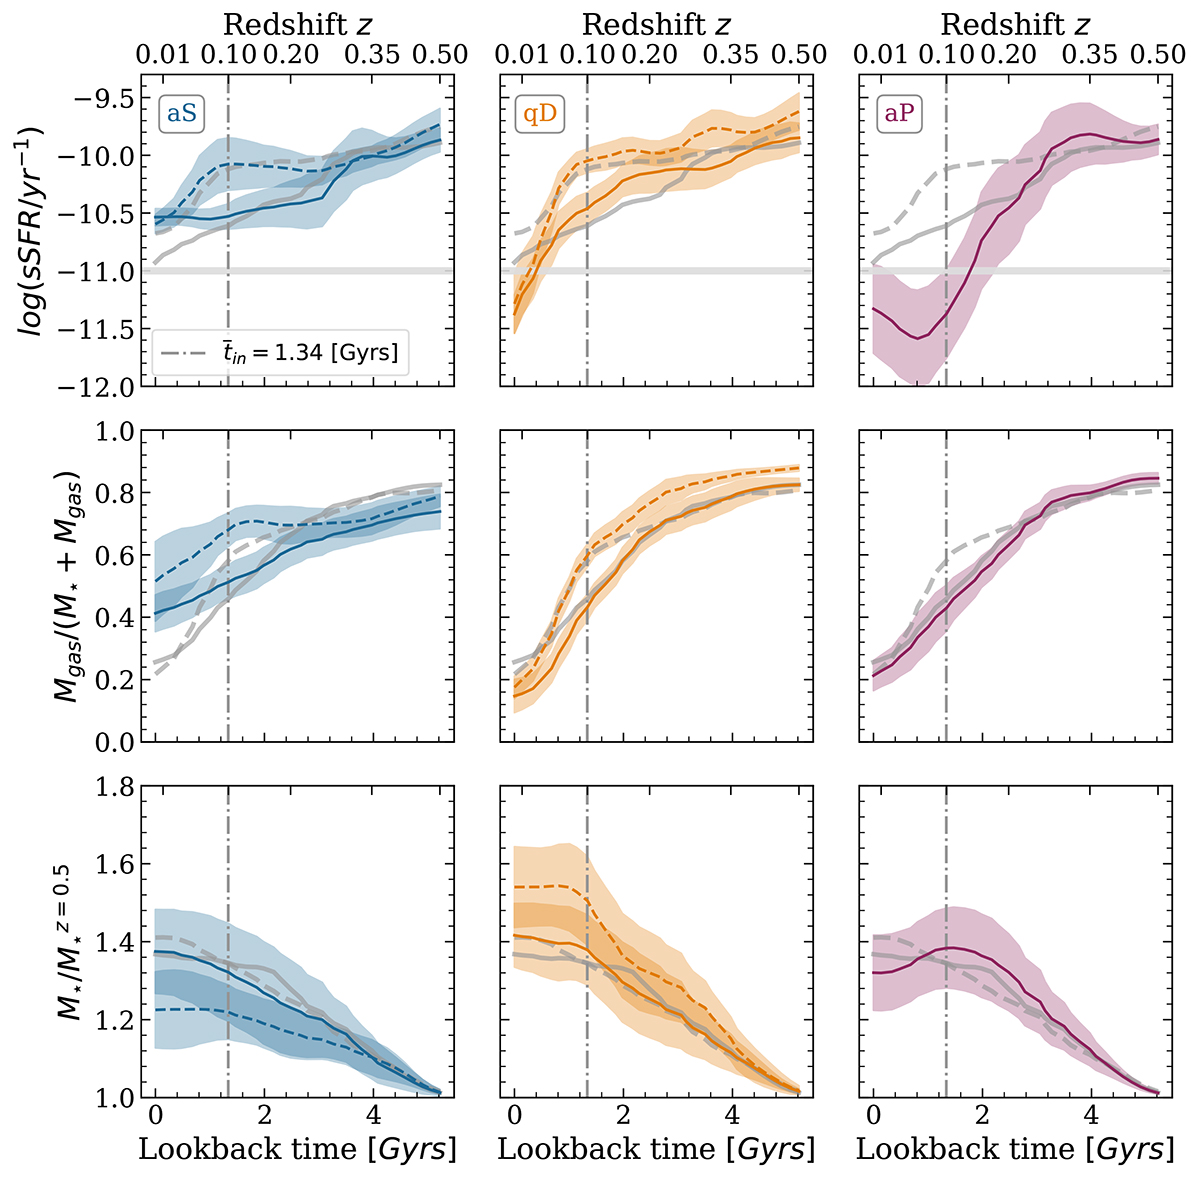
Evolution of astrophysical properties of green RINs from z = 0.5 to z = 0 for the three sub-classes. The panels display, from top to bottom: Specific SFR, gas fraction relative to M⋆ + Mgas, and stellar mass normalised to its value at z = 0.5. Solid and dashed lines represent trends for high- and low-mass galaxies, respectively, with shaded regions indicating bootstrap-derived error bars. For comparison, the results found in Fig. 5 for the total sample of green RINs are reproduced across all properties. The horizontal light grey line indicates the threshold for classifying galaxies as SF or PS. The vertical line indicates the median entry time of green RINs into the group’s virial region.
Current usage metrics show cumulative count of Article Views (full-text article views including HTML views, PDF and ePub downloads, according to the available data) and Abstracts Views on Vision4Press platform.
Data correspond to usage on the plateform after 2015. The current usage metrics is available 48-96 hours after online publication and is updated daily on week days.
Initial download of the metrics may take a while.