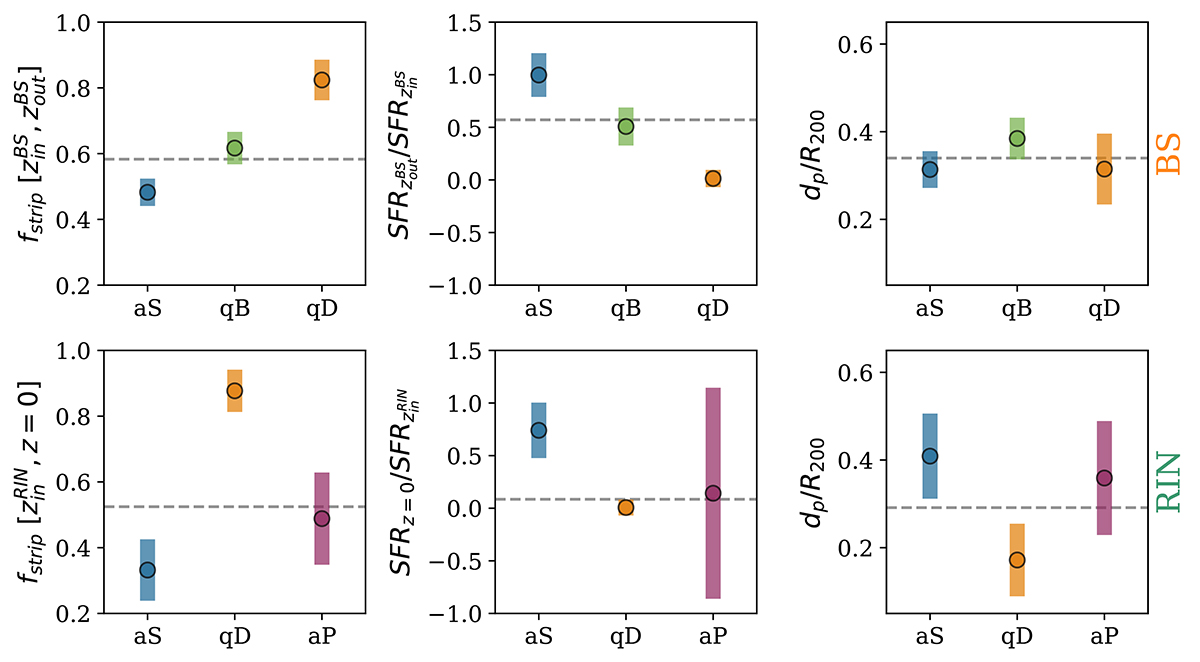
Fig. 11.

Download original image
Fraction of stripped mass (left), SFR ratio (centre), and minimum pericentric distance normalised to the virial radius (right) for the green BS galaxy sub-types (upper panels) are shown for the period from their entry into the R200 region until they exit. Similarly, for the green RINs sub-types (lower panels), the analysis covers the period from their entry into the R200 region until z = 0. Circles represent the median values, while bars indicate the standard deviation, calculated using the bootstrap method for each sub-type. The dashed grey horizontal lines denote the median values of the green galaxies of the corresponding properties.
Current usage metrics show cumulative count of Article Views (full-text article views including HTML views, PDF and ePub downloads, according to the available data) and Abstracts Views on Vision4Press platform.
Data correspond to usage on the plateform after 2015. The current usage metrics is available 48-96 hours after online publication and is updated daily on week days.
Initial download of the metrics may take a while.


