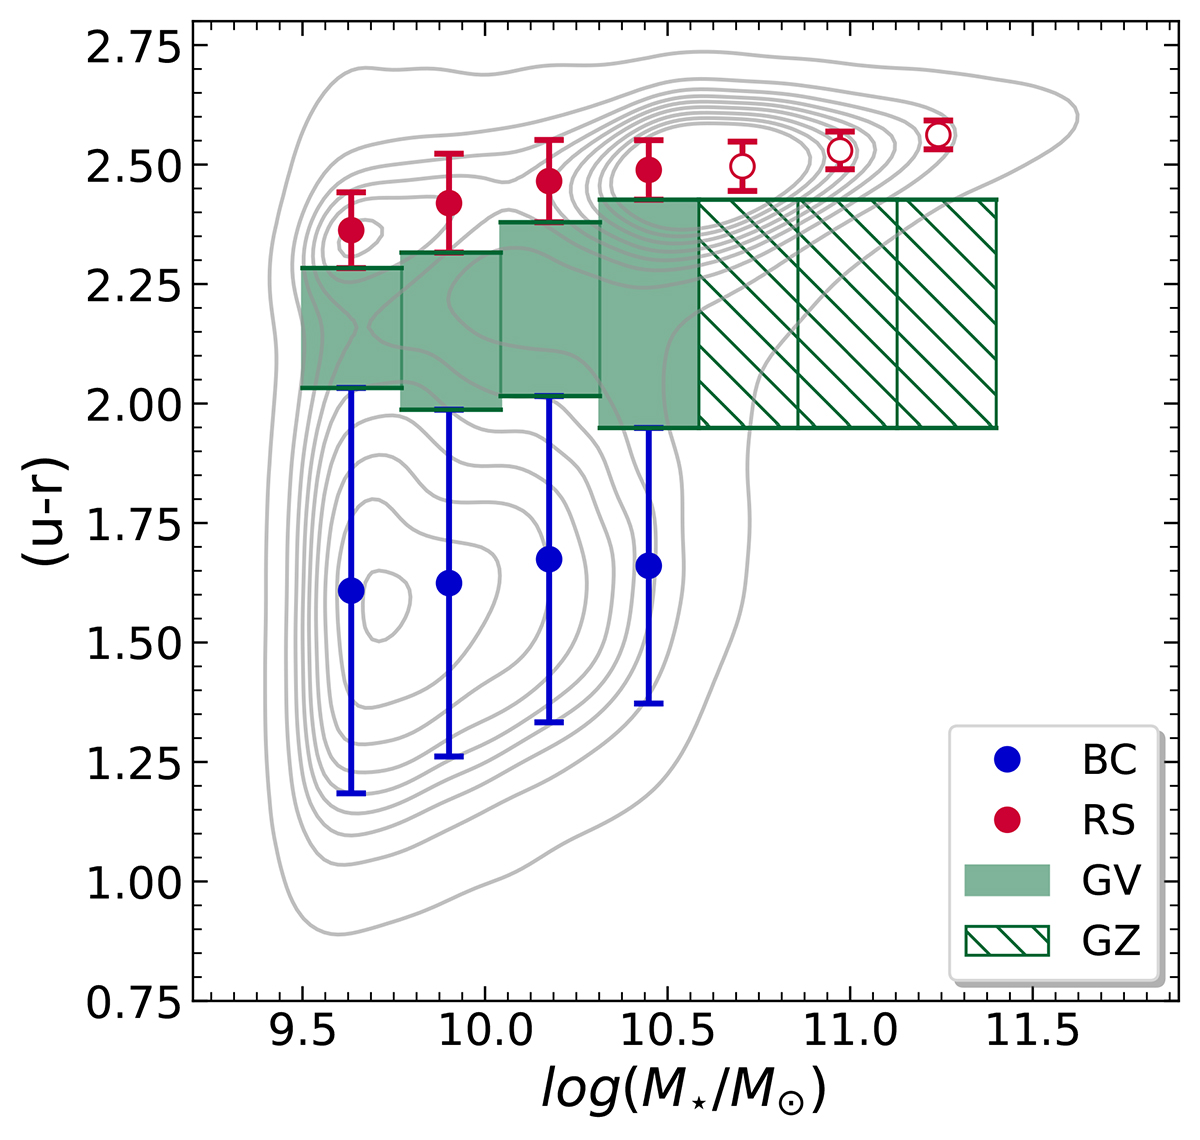
Fig. 1.
Download original image
(u − r) colour vs. stellar mass diagram (CMD) for our random sample independent of the environment. The CMD density isocontours are shown in gray. Points with error bars represent the mean and standard deviation of Gaussian fits for the blue cloud (BC, blue symbols) and the red sequence (RS, red symbols) as a function of stellar mass. The shaded region represents the GV, which comprises 13.15% of the sample of galaxies, while the hatched area designates the GZ, which contains 3.75% of the sample.
Current usage metrics show cumulative count of Article Views (full-text article views including HTML views, PDF and ePub downloads, according to the available data) and Abstracts Views on Vision4Press platform.
Data correspond to usage on the plateform after 2015. The current usage metrics is available 48-96 hours after online publication and is updated daily on week days.
Initial download of the metrics may take a while.