Fig. 3
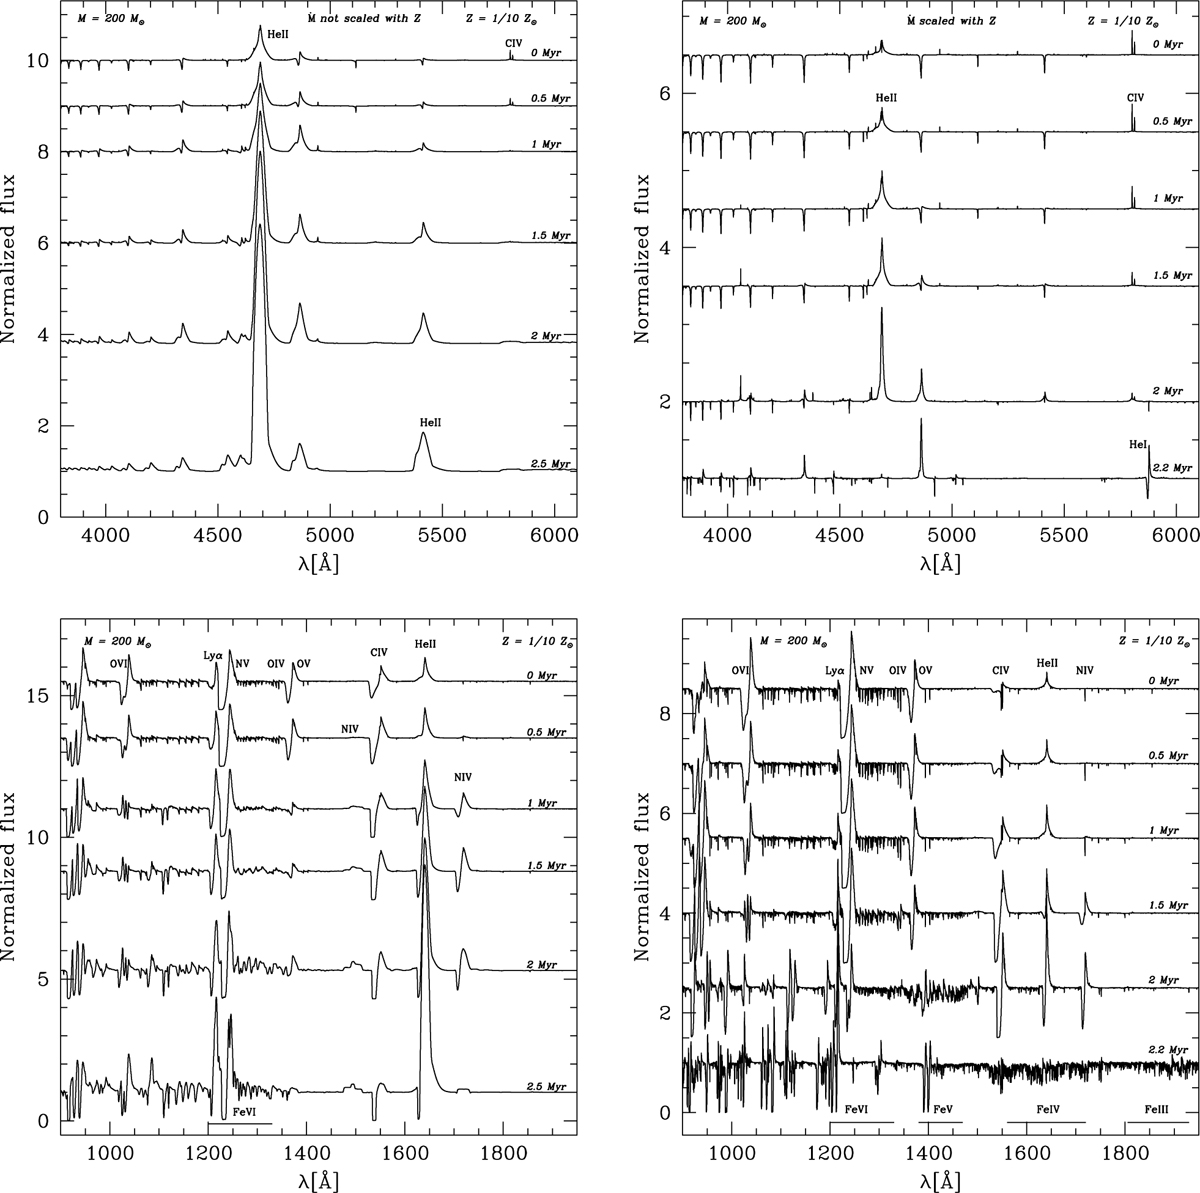
Download original image
Synthetic optical (top) and UV (bottom) spectra of the 200 M⊙ models at Z = 0.1 Z⊙. The left (right) panels correspond to models without (with) metallicity scaling of the mass-loss rates. In all panels, the spectra from top to bottom correspond to models with 0.01, 0.5, 1, 1.5, 2, and 2.5(2.2) Myr as marked by squares on the evolutionary track in Fig. 1 and with parameters given in Tables A.3 and A.4. Spectra are shifted vertically for clarity.
Current usage metrics show cumulative count of Article Views (full-text article views including HTML views, PDF and ePub downloads, according to the available data) and Abstracts Views on Vision4Press platform.
Data correspond to usage on the plateform after 2015. The current usage metrics is available 48-96 hours after online publication and is updated daily on week days.
Initial download of the metrics may take a while.