Open Access
Fig. 19
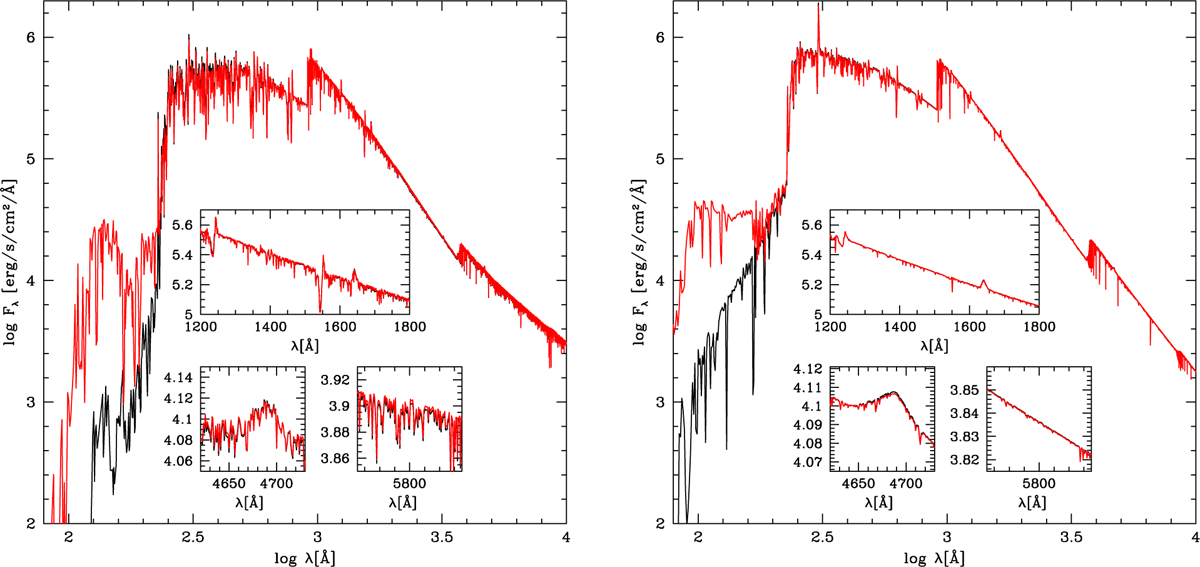
Download original image
Comparison between the spectrum of the initial CSF population synthesis models at 10 Myr (black line) and the spectrum of a test model in which the contribution of evolved phases of evolution is included (red line). The left (right) panel is for Z = 0.1 (0.01) Z⊙.
Current usage metrics show cumulative count of Article Views (full-text article views including HTML views, PDF and ePub downloads, according to the available data) and Abstracts Views on Vision4Press platform.
Data correspond to usage on the plateform after 2015. The current usage metrics is available 48-96 hours after online publication and is updated daily on week days.
Initial download of the metrics may take a while.