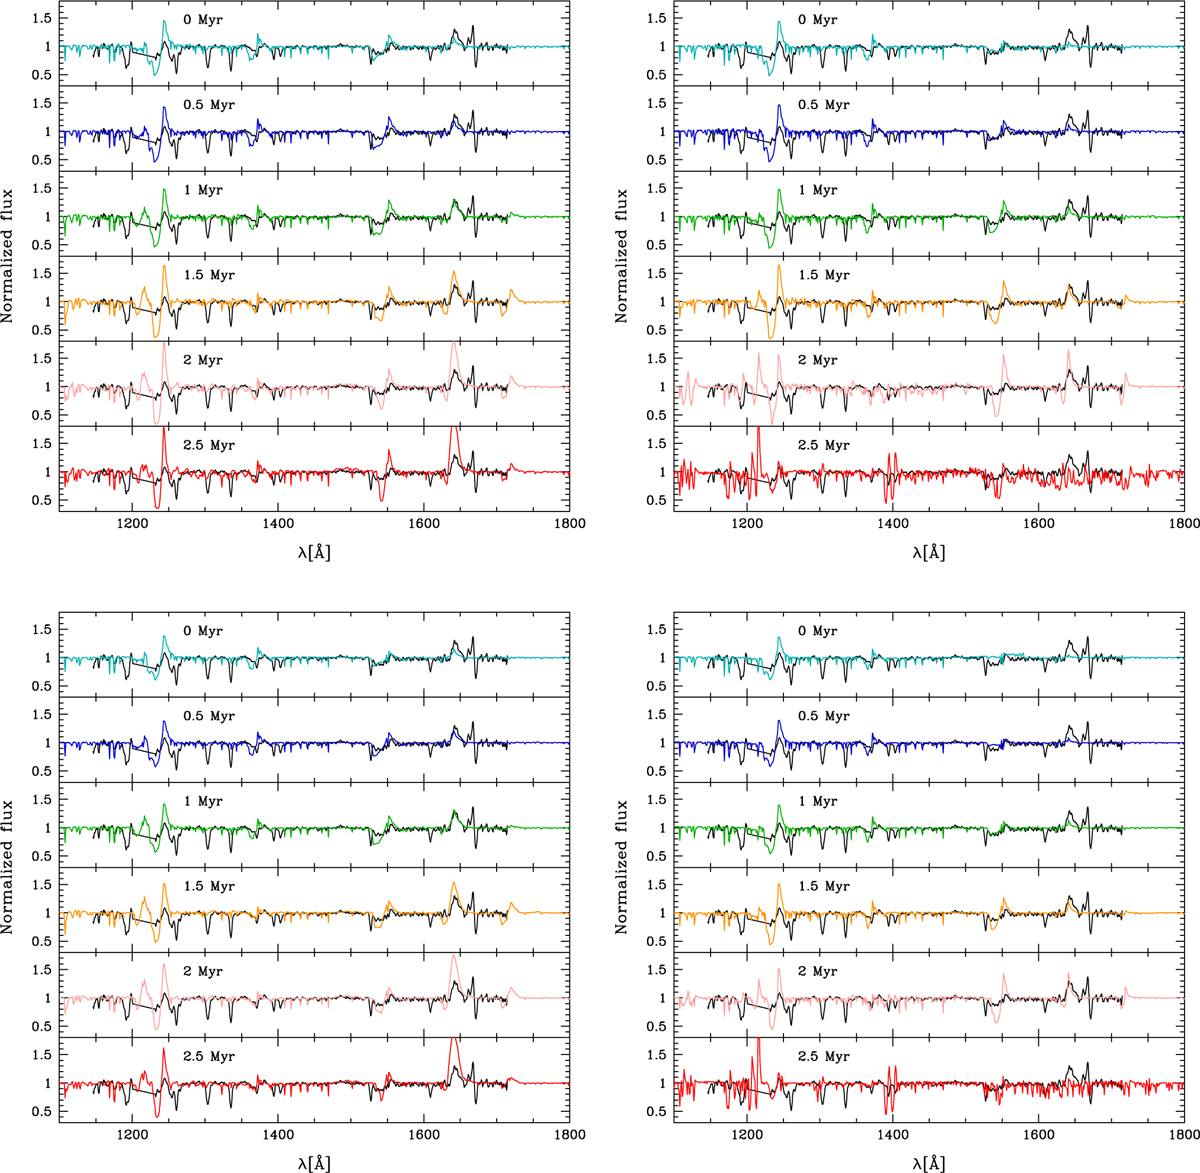
Fig. 17
Download original image
Comparison between burst population synthesis models including VMSs up to 225 M⊙ and the observed UV spectrum of MrK71-A (black line). Top (bottom) models are for Z = 0.2 (0.1) Z⊙. In each panel ages range from 0 to 2.5 Myr from top to bottom. The left (right) panels correspond to models without (with) metallicity scaling of the VMS mass-loss rates.
Current usage metrics show cumulative count of Article Views (full-text article views including HTML views, PDF and ePub downloads, according to the available data) and Abstracts Views on Vision4Press platform.
Data correspond to usage on the plateform after 2015. The current usage metrics is available 48-96 hours after online publication and is updated daily on week days.
Initial download of the metrics may take a while.