Fig. 16
Download original image
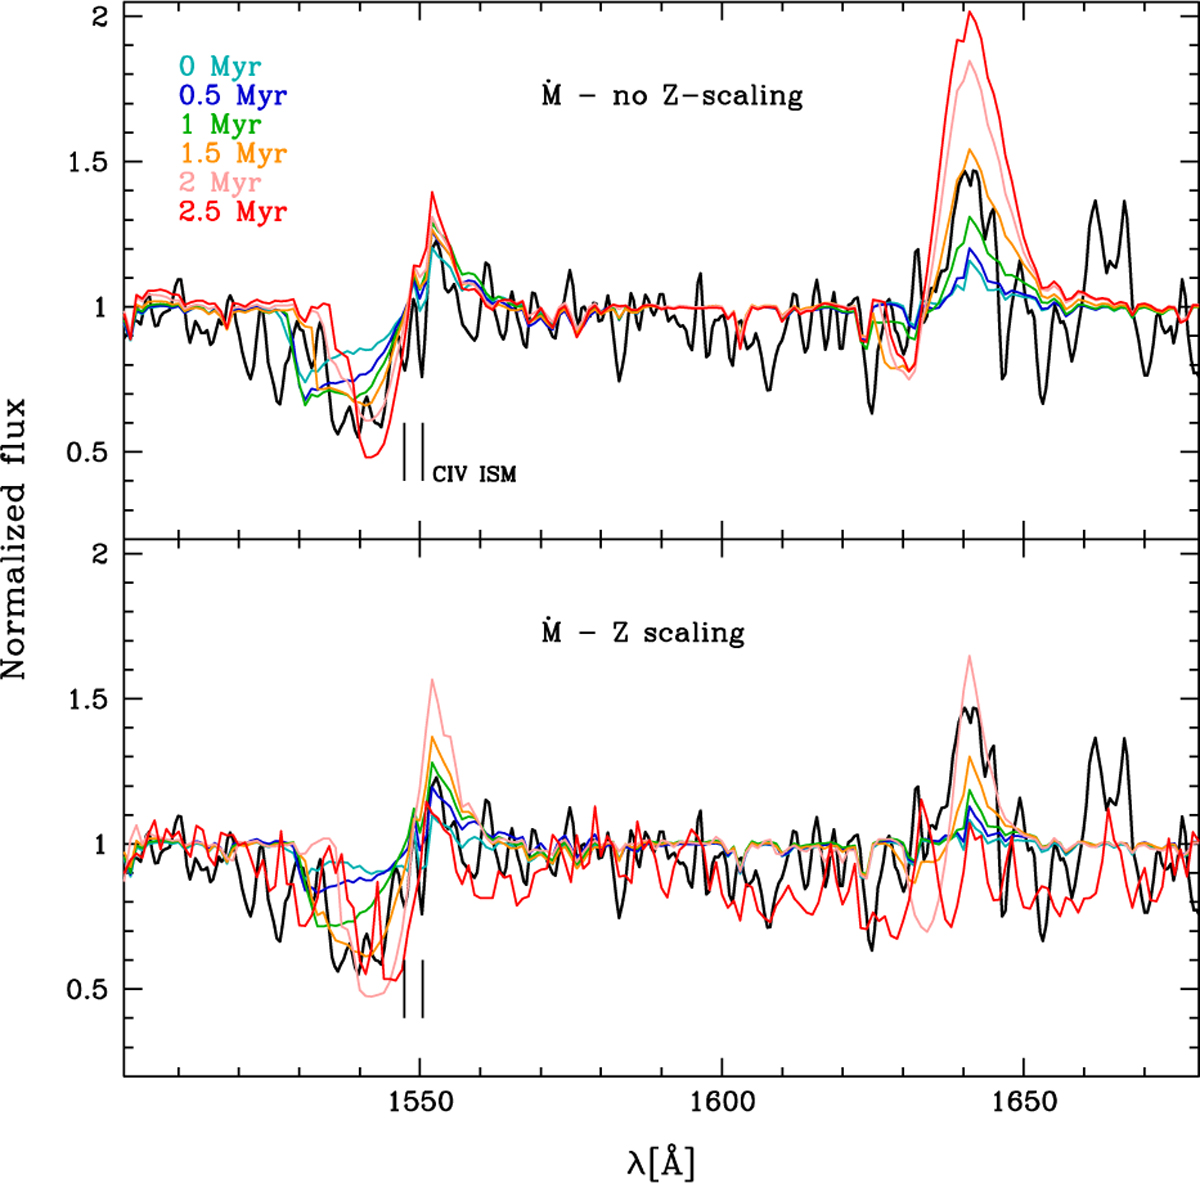
Comparison between burst population synthesis models including VMSs up to 225 M⊙ to the observed UV spectrum of cluster A in II Zw 40 (black line). All models are for Z = 0.2 Z⊙ that is close to the metallicity of the cluster. Ages range from 0 to 2.5 Myr and are colour-coded as indicated in the top panel. The top (bottom) panel corresponds to models without (with) metallicity scaling of the VMS mass-loss rates. The vertical black lines indicate the Galactic nebular C IV absorption.
Current usage metrics show cumulative count of Article Views (full-text article views including HTML views, PDF and ePub downloads, according to the available data) and Abstracts Views on Vision4Press platform.
Data correspond to usage on the plateform after 2015. The current usage metrics is available 48-96 hours after online publication and is updated daily on week days.
Initial download of the metrics may take a while.