Open Access
Fig. B.1
Download original image
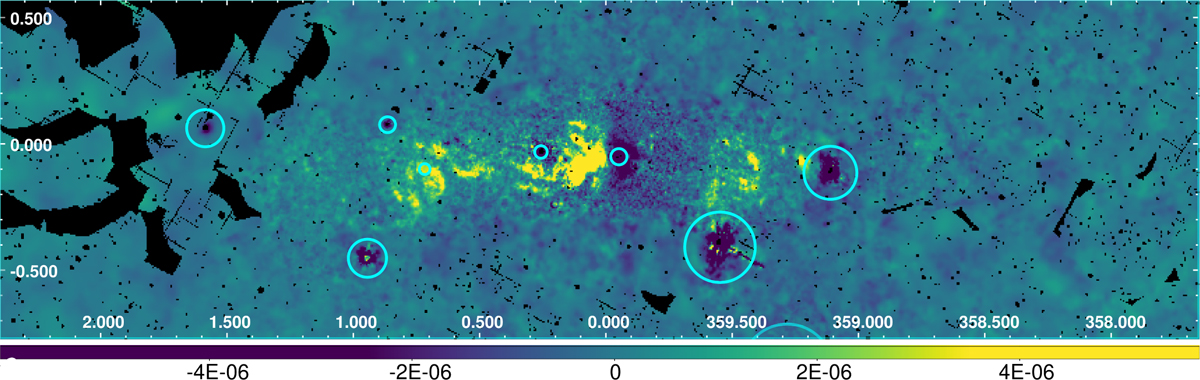
Example of the cleaned X64 band maps (X64 minus C-X67-X50) when masking only for bright sources. The mask is shown with the cyan circles. Significant negative residuals remain at the GC near Sgr A* and near the bight sources.
Current usage metrics show cumulative count of Article Views (full-text article views including HTML views, PDF and ePub downloads, according to the available data) and Abstracts Views on Vision4Press platform.
Data correspond to usage on the plateform after 2015. The current usage metrics is available 48-96 hours after online publication and is updated daily on week days.
Initial download of the metrics may take a while.