Fig. 5
Download original image
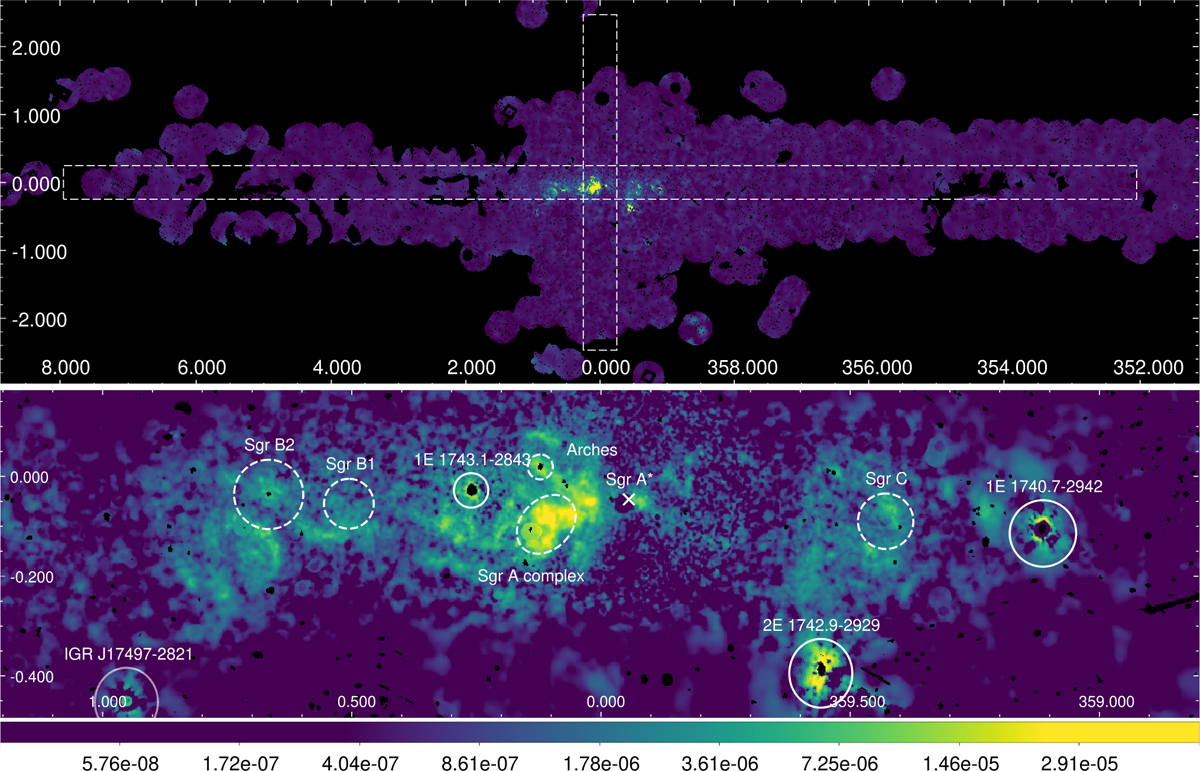
X64 cleaned full map and zoomed-in view, averaged over ∼20 years of XMM-Newton observations. Top: X-ray emission across the entire X64 cleaned map representing the reflection. The white rectangular regions indicate the areas used for profile extraction. Bottom: zoomed-in view of the central degrees of the Galaxy, where the reflected emission is concentrated. Bright sources masked out during the analysis are marked with solid white circles, while known molecular clouds are outlined in dashed white. The position of Sgr A* is denoted by an X.
Current usage metrics show cumulative count of Article Views (full-text article views including HTML views, PDF and ePub downloads, according to the available data) and Abstracts Views on Vision4Press platform.
Data correspond to usage on the plateform after 2015. The current usage metrics is available 48-96 hours after online publication and is updated daily on week days.
Initial download of the metrics may take a while.