Fig. 3
Download original image
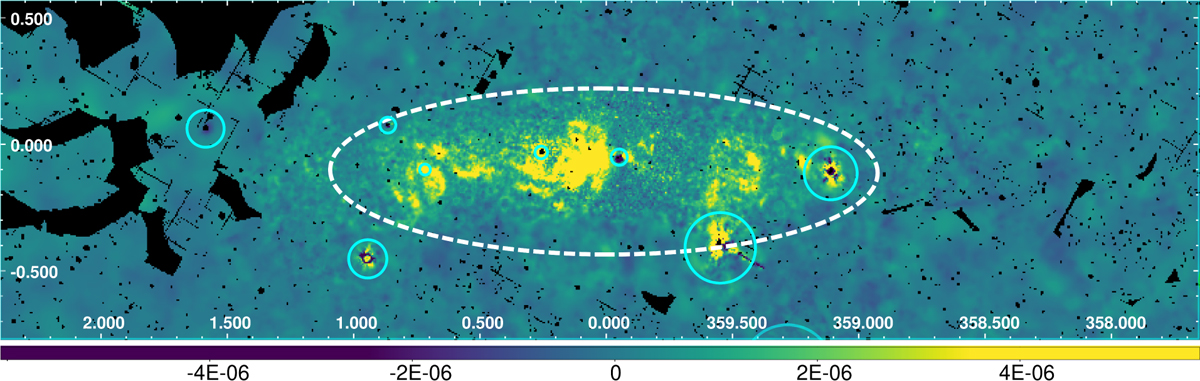
Example of the cleaned X64 band map (X64 minus C-X67-X50). The mask is shown as a dashed ellipse, and solid circles correspond to bright sources. The map is in units of counts per second per pixel. Black regions indicate areas with no exposure, which may result from the removal of point sources, stray-light artefacts, or chip gaps.
Current usage metrics show cumulative count of Article Views (full-text article views including HTML views, PDF and ePub downloads, according to the available data) and Abstracts Views on Vision4Press platform.
Data correspond to usage on the plateform after 2015. The current usage metrics is available 48-96 hours after online publication and is updated daily on week days.
Initial download of the metrics may take a while.