Fig. 2
Download original image
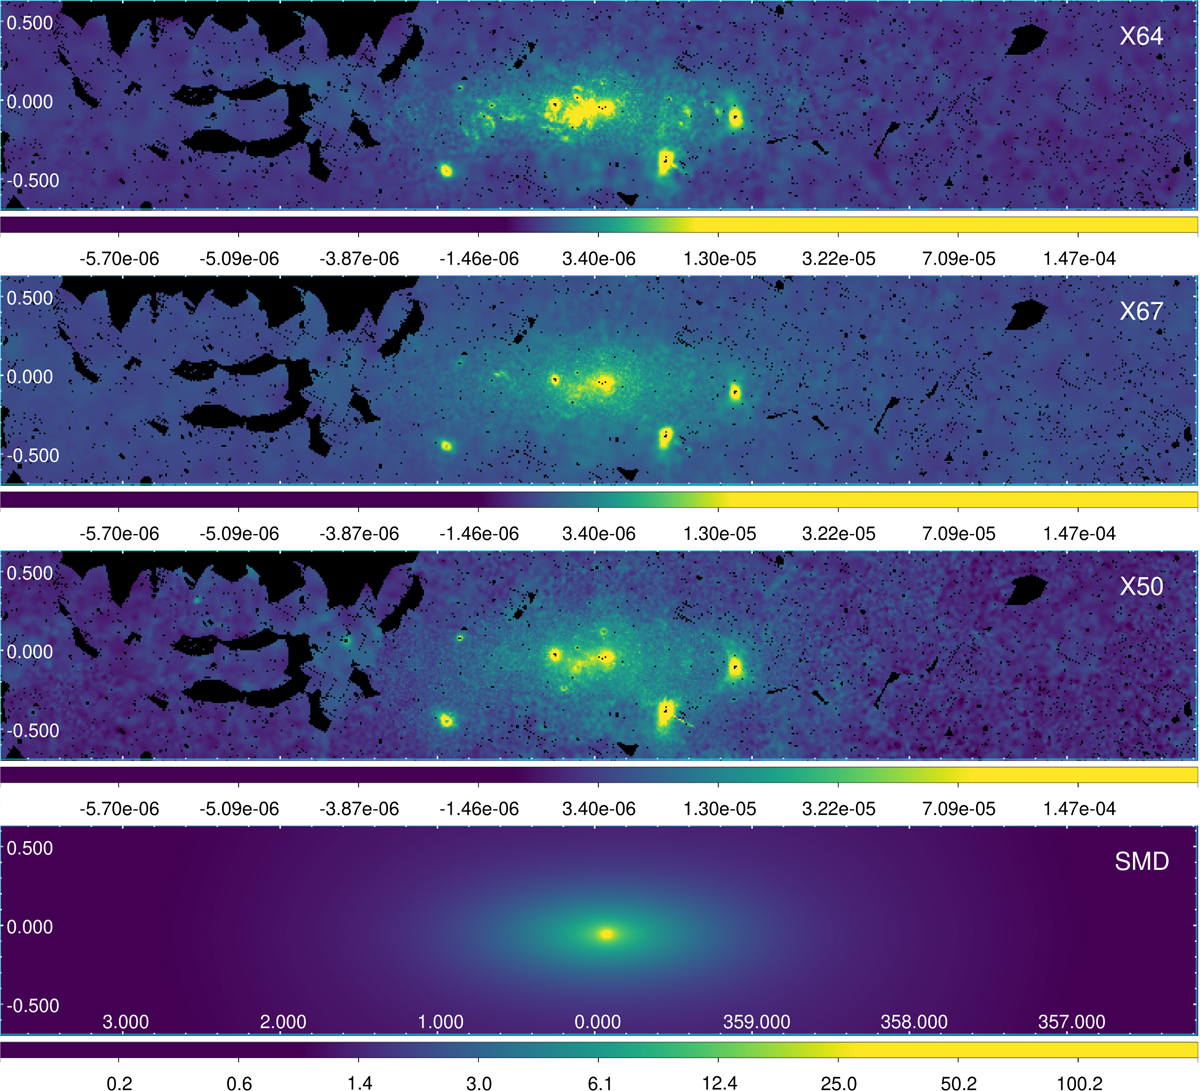
Raw maps used in this study. From top to bottom: the XMM-Newton 6.4 keV (X64), 6.7 keV (X67), the continuum band (X50), and the SMD. The XMM-Newton maps are measured in count per second per pixel (cr/pix), whereas the SMD map represents stellar density in 103 M⊙/pix. The colour bar ranges are selected arbitrarily to emphasise and display morphological differences. The x-axis and y-axis represent the Galactic longitude and latitude, respectively, in degrees.
Current usage metrics show cumulative count of Article Views (full-text article views including HTML views, PDF and ePub downloads, according to the available data) and Abstracts Views on Vision4Press platform.
Data correspond to usage on the plateform after 2015. The current usage metrics is available 48-96 hours after online publication and is updated daily on week days.
Initial download of the metrics may take a while.