Fig. 1
Download original image
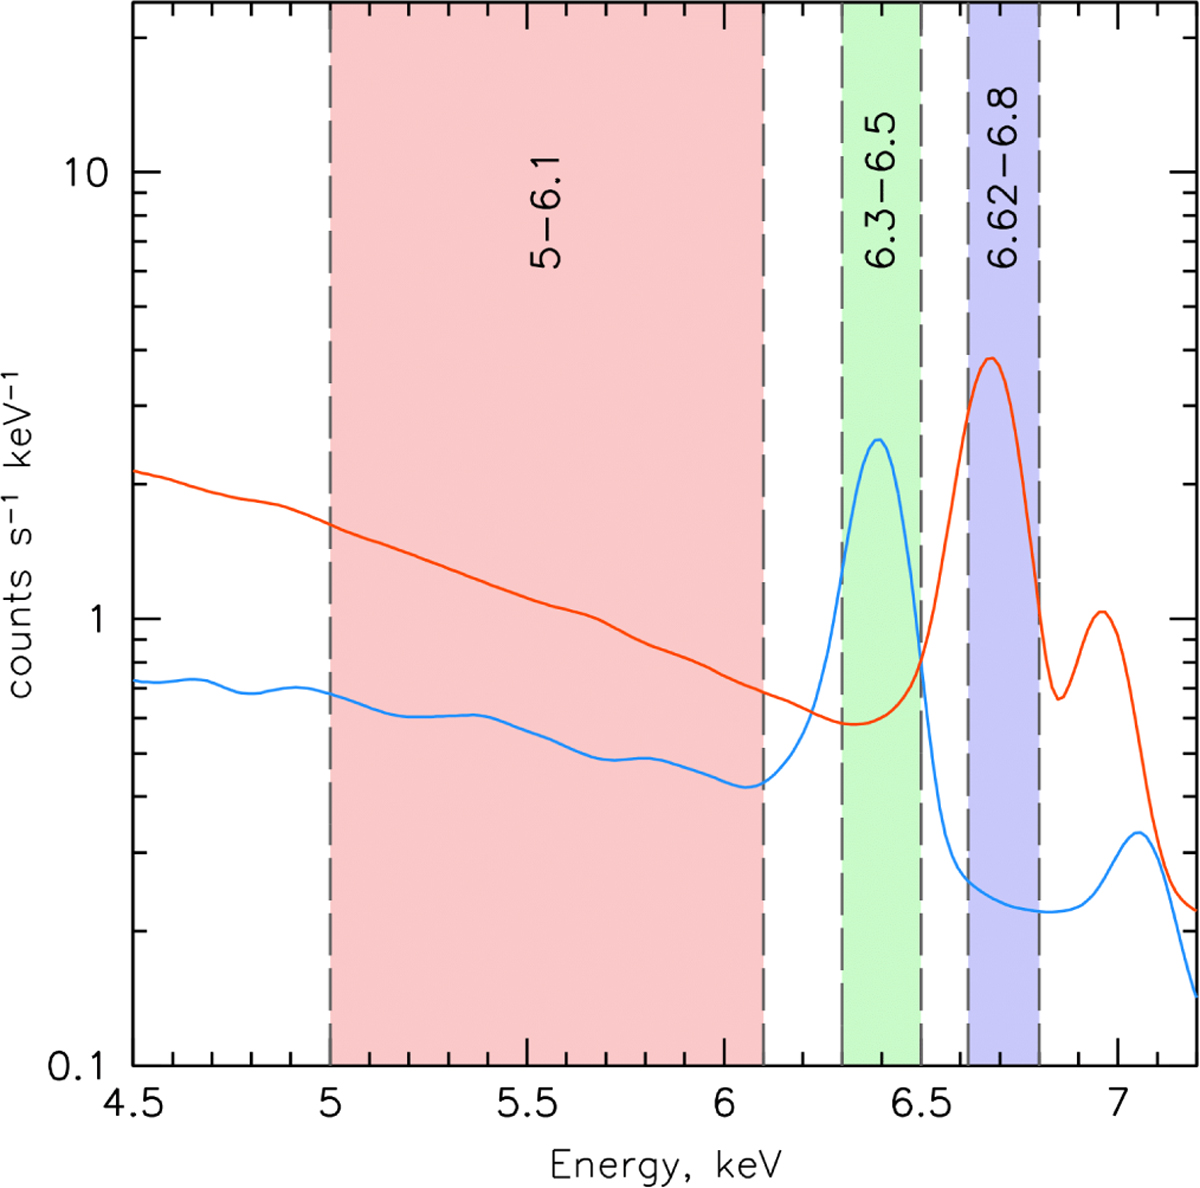
Spectral representation of the three energy bands used in this project. The bands are highlighted by the shaded regions. The representative model spectra (convolved with the XMM-Newton spectra response function) of hot plasma (apec model in XSPEC) and reflection (crefl16 model; Churazov et al. 2017b) are shown as orange and blue lines, respectively.
Current usage metrics show cumulative count of Article Views (full-text article views including HTML views, PDF and ePub downloads, according to the available data) and Abstracts Views on Vision4Press platform.
Data correspond to usage on the plateform after 2015. The current usage metrics is available 48-96 hours after online publication and is updated daily on week days.
Initial download of the metrics may take a while.