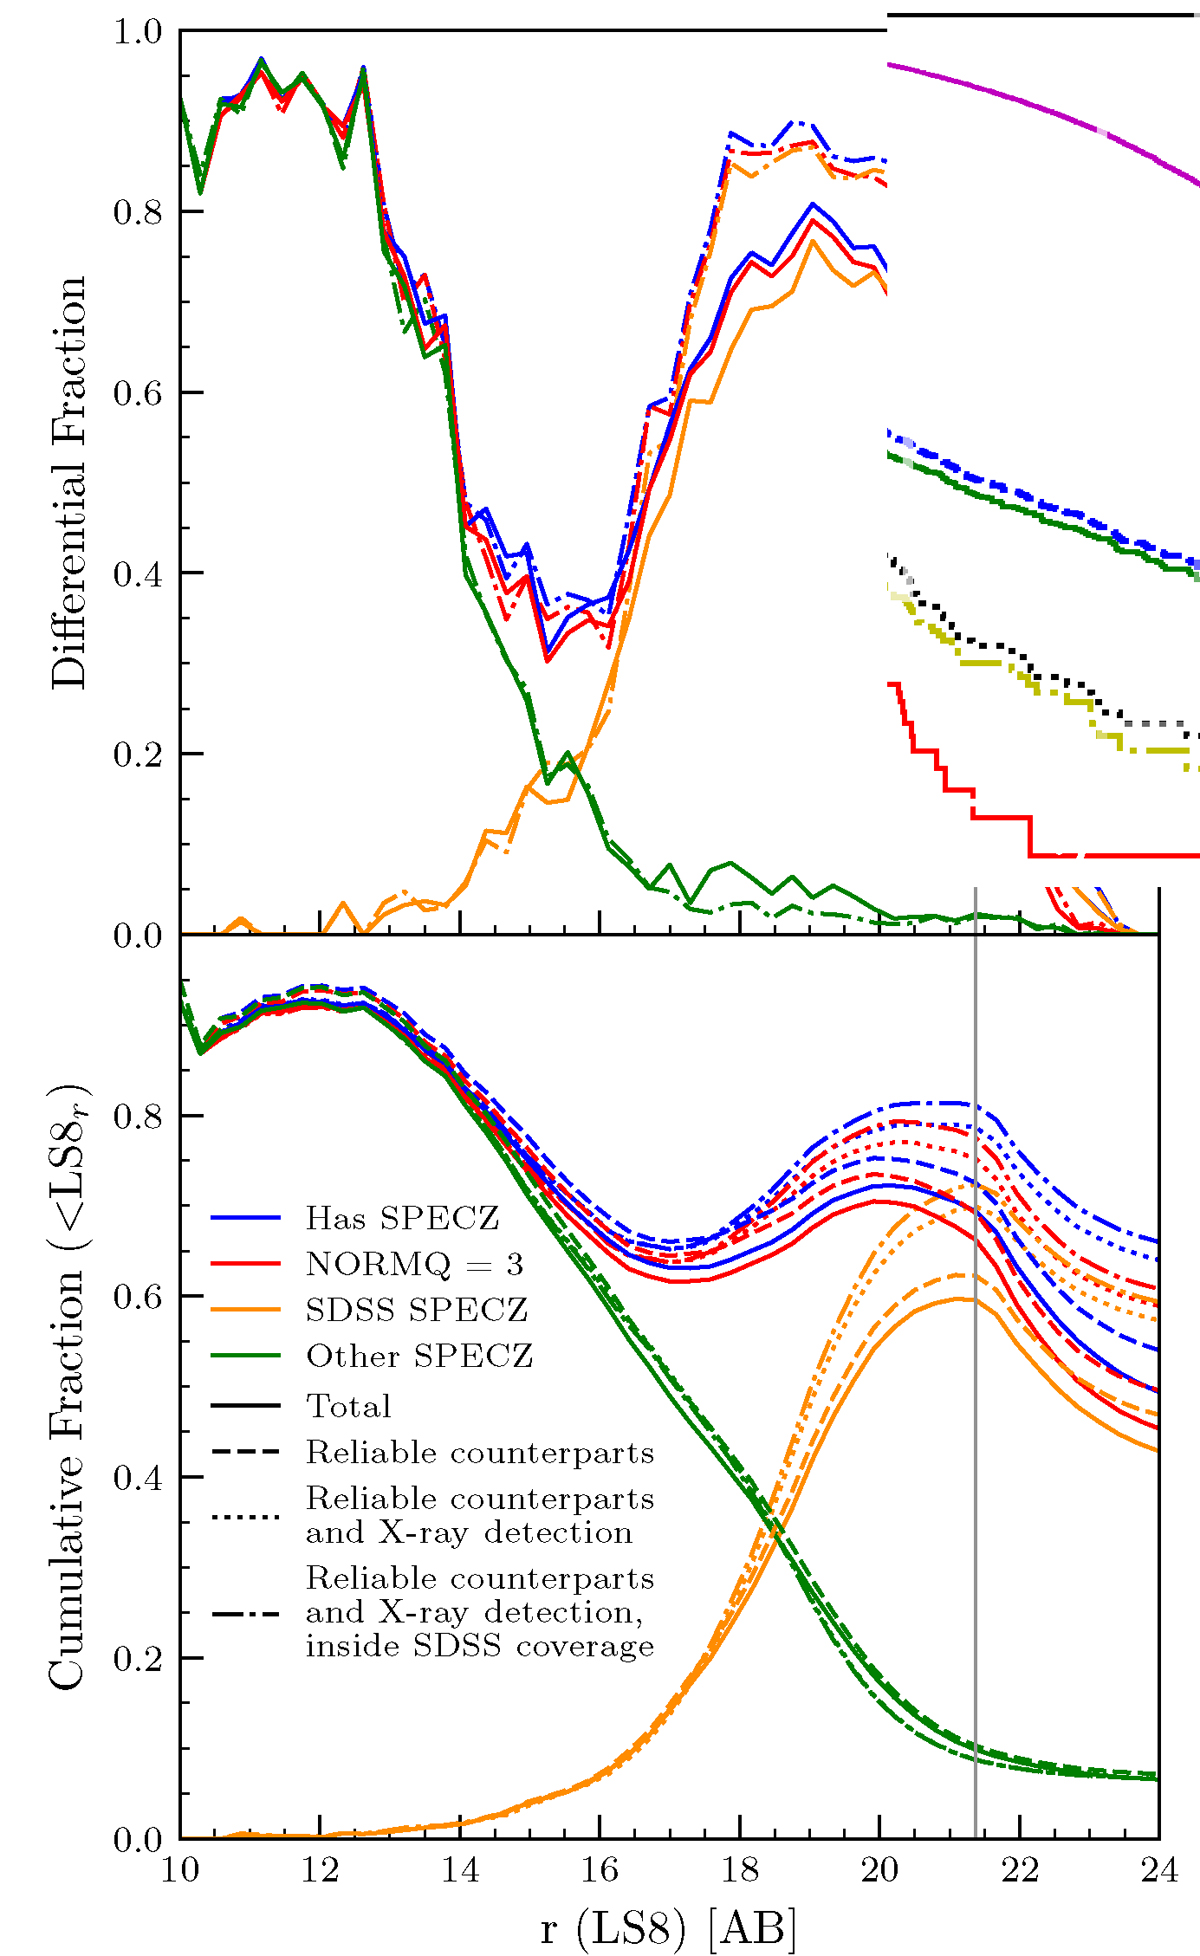
Fig. 9.
Download original image
Differential (top) and cumulative (bottom) spectroscopic completeness fractions as a function of the r-band magnitude (top) or r-band magnitude limit (bottom). Blue lines are for all objects with a spectroscopic redshift from any survey (see Sect. 3.2), orange for those whose spec-z was obtained from SDSS, and green for other surveys. Red curves indicate the cases of high confidence for the redshift estimate after visual inspection. For each colour, the different parent samples are represented with different line styles: full sample (solid), only objects with reliable counterparts (CTP_QUALITY > 1; dashed), objects with reliable counterparts and a highly reliable X-ray detection (DET_LIKE > 10; dotted) and the most conservative case of objects with a reliable counterpart, reliable X-ray detection, and within the SDSS field coverage (Dec > 2; dot-dashed). The vertical grey line indicates r = 21.38, where the most complete sub-sample of objects with redshift from SDSS reaches its maximum fraction (dash-dotted orange line).
Current usage metrics show cumulative count of Article Views (full-text article views including HTML views, PDF and ePub downloads, according to the available data) and Abstracts Views on Vision4Press platform.
Data correspond to usage on the plateform after 2015. The current usage metrics is available 48-96 hours after online publication and is updated daily on week days.
Initial download of the metrics may take a while.