Fig. 8.
Download original image
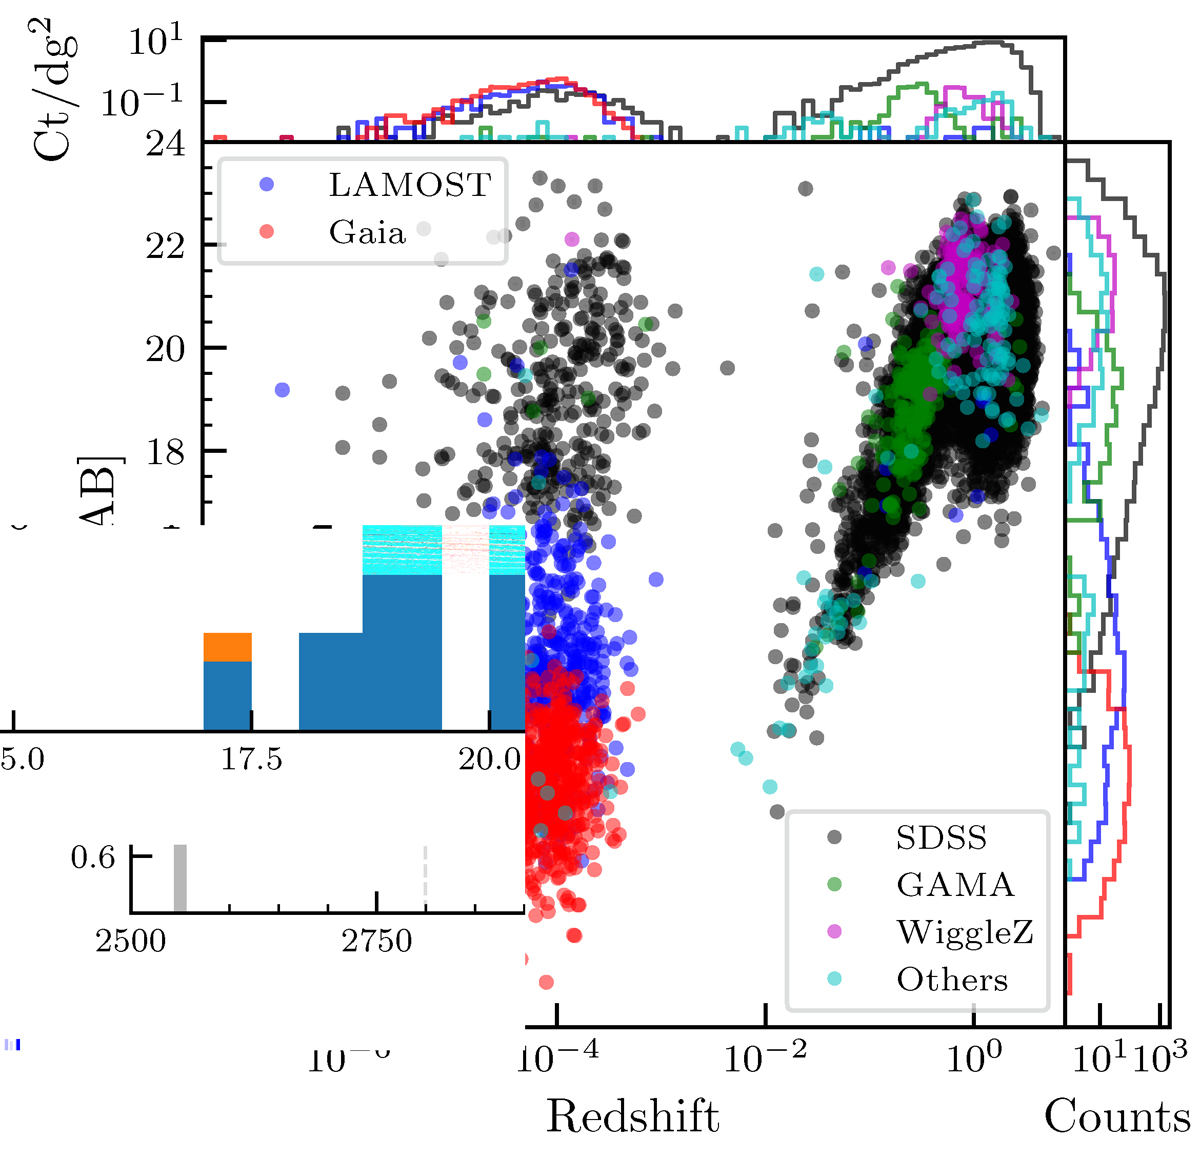
r-band magnitude as a function of the absolute value of the redshift, colour-coded by the survey that provided the redshift measurement (see Nlead, X − ray in Table 1). The upper histogram shows the redshift distribution with regard to the number of counts divided by the eFEDS area (140 deg2 as in the green contour of Fig. 1, Brunner et al. 2022), while the histogram on the right displays the number of counts for r-band distribution. The absolute value of the redshift is plotted to allow the display of Galactic objects (|z|≲10−3) with negative radial velocities.
Current usage metrics show cumulative count of Article Views (full-text article views including HTML views, PDF and ePub downloads, according to the available data) and Abstracts Views on Vision4Press platform.
Data correspond to usage on the plateform after 2015. The current usage metrics is available 48-96 hours after online publication and is updated daily on week days.
Initial download of the metrics may take a while.