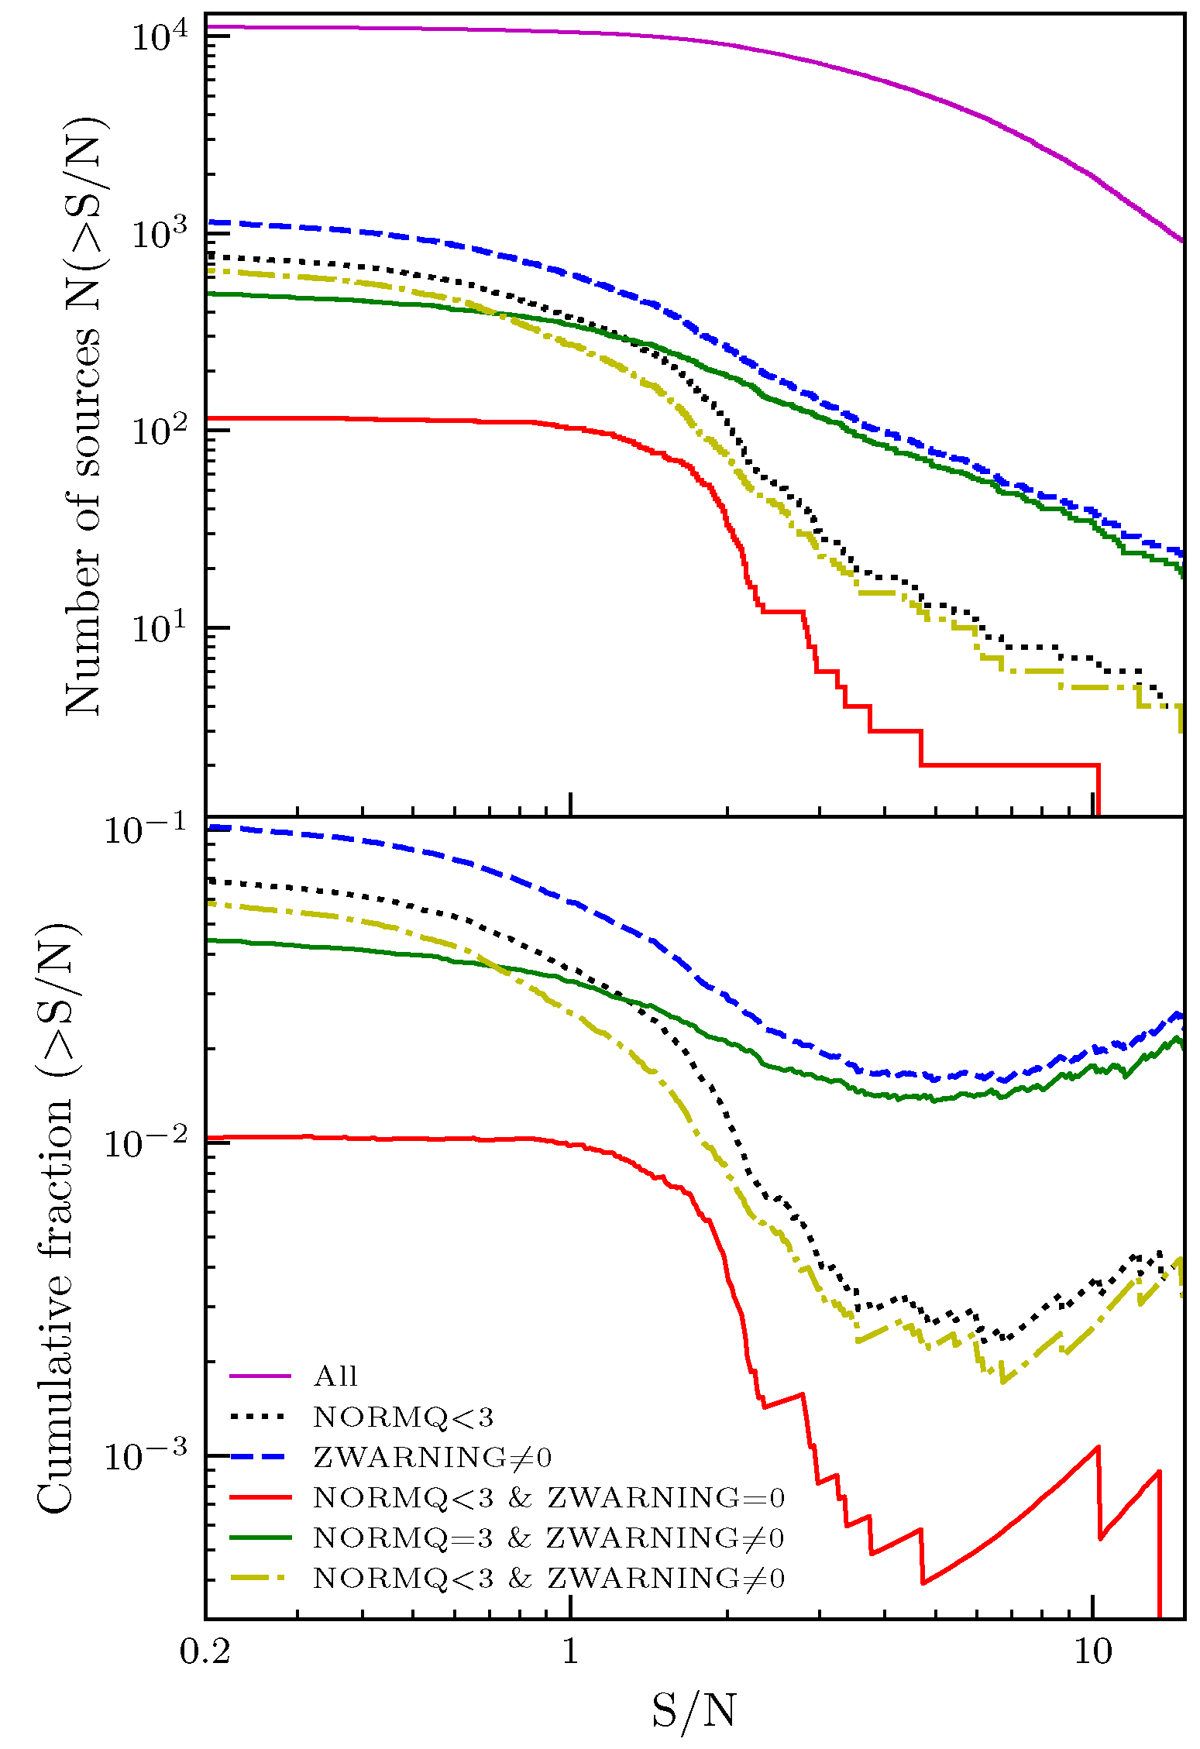
Fig. 4.
Download original image
Diagnostic plot of the visual inspection. As a function of the median signal-to-noise ratio provided by the SDSS pipeline, we show the cumulative distribution (top) and cumulative normalised fraction (bottom) of different samples defined based on their SDSS pipeline (ZWARNING) vs. VI redshift measurement quality (NORMQ). The black dotted line represents the cases that are lost for science since their redshifts are not reliable according to the VI process (NORMQ < 3). The blue dashed curve shows the cases for which SDSS data and/or pipeline fit are flagged as being problematic in some way(ZWARNING ≠ 0); the difference between the blue and the black lines shows the recovery of the VI. The red line indicates the most problematic cases, in which the visually inspected redshift is not reliable (NORMQ < 3), but there was no indication from the SDSS pipeline that the redshift could be wrongly assessed (ZWARNING = 0). The yellow dash-dotted line shows the other cases in which the redshift could not be recovered (NORMQ < 3), but for which the SDSS pipeline indicated some problem (ZWARNING ≠ 0). The combination of the red and yellow samples gives the total number of objects lost for science (black line). The green line represents the cases in which VI was needed (ZWARNING ≠ 0) and successful (NORMQ = 3).
Current usage metrics show cumulative count of Article Views (full-text article views including HTML views, PDF and ePub downloads, according to the available data) and Abstracts Views on Vision4Press platform.
Data correspond to usage on the plateform after 2015. The current usage metrics is available 48-96 hours after online publication and is updated daily on week days.
Initial download of the metrics may take a while.