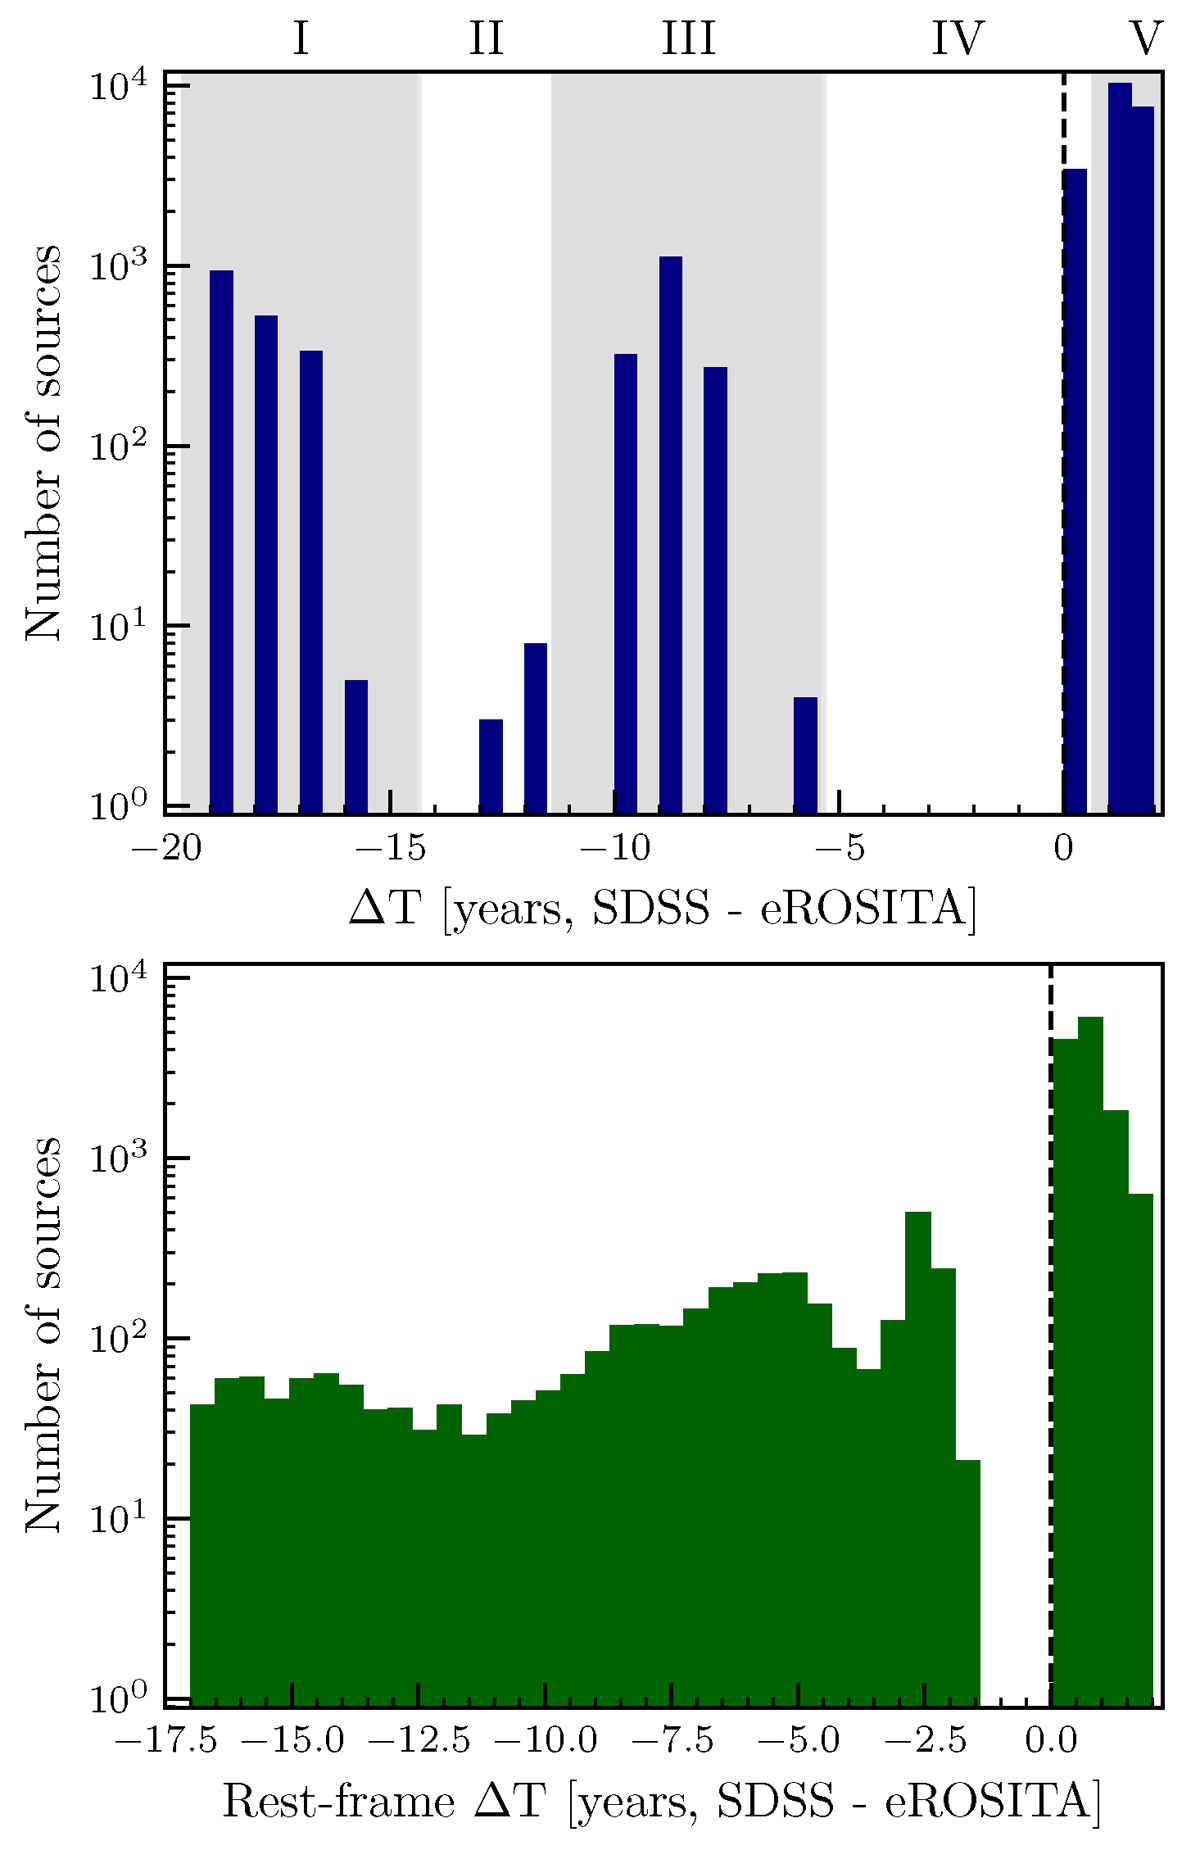
Fig. 2.
Download original image
Time difference between observations from SDSS and eROSITA. The top panel shows MJDSDSS–MJDeROSITA– in years. We highlight the different generations of SDSS as shaded regions, with SDSS I-III observations covering negative values (SDSS spectroscopy preceding eROSITA observations), while SDSS IV–V observations are to the right of the dashed line, indicating spectroscopic observations following the X-ray ones. The bottom panel displays the same time difference divided by (1 + z), showing the time difference in the rest-frame.
Current usage metrics show cumulative count of Article Views (full-text article views including HTML views, PDF and ePub downloads, according to the available data) and Abstracts Views on Vision4Press platform.
Data correspond to usage on the plateform after 2015. The current usage metrics is available 48-96 hours after online publication and is updated daily on week days.
Initial download of the metrics may take a while.