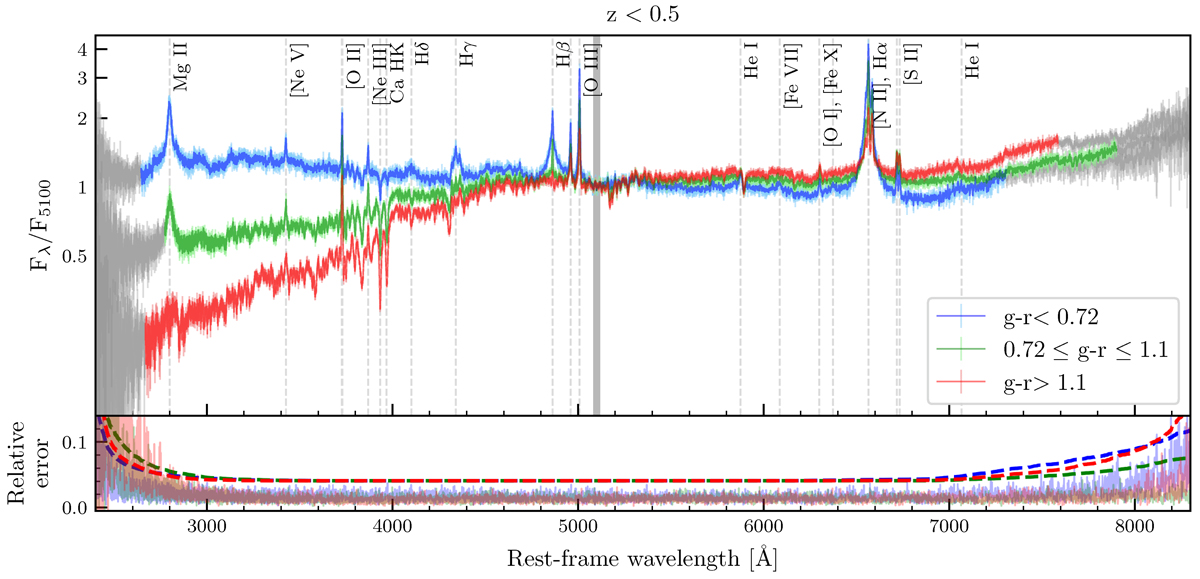
Fig. 17.
Download original image
Median stacked spectra for AGNs with z < 0.5, with the flux normalised at 5100 Å. The total sub-sample of z < 0.5 AGNs was divided into three colour bins with 614 sources each. The top panel shows with coloured lines the wavelength coverage where more than 50% of the total individual spectra contribute, with the remaining wavelength with less than half of the spectra in the stack shown in grey; the colour scheme is the same as Fig. 14. Some of the main emission and absorption lines are indicated with dashed vertical lines. The grey-filled line indicates the wavelength range around 5100 Å whose average flux was used for the normalisation. The bottom panel shows the errors calculated via the Jack Knife method in the stacking procedure divided by the median stack, and the dashed lines show ![]() , where N is the number of individual sources per stacked pixel.
, where N is the number of individual sources per stacked pixel.
Current usage metrics show cumulative count of Article Views (full-text article views including HTML views, PDF and ePub downloads, according to the available data) and Abstracts Views on Vision4Press platform.
Data correspond to usage on the plateform after 2015. The current usage metrics is available 48-96 hours after online publication and is updated daily on week days.
Initial download of the metrics may take a while.