Fig. 11.
Download original image
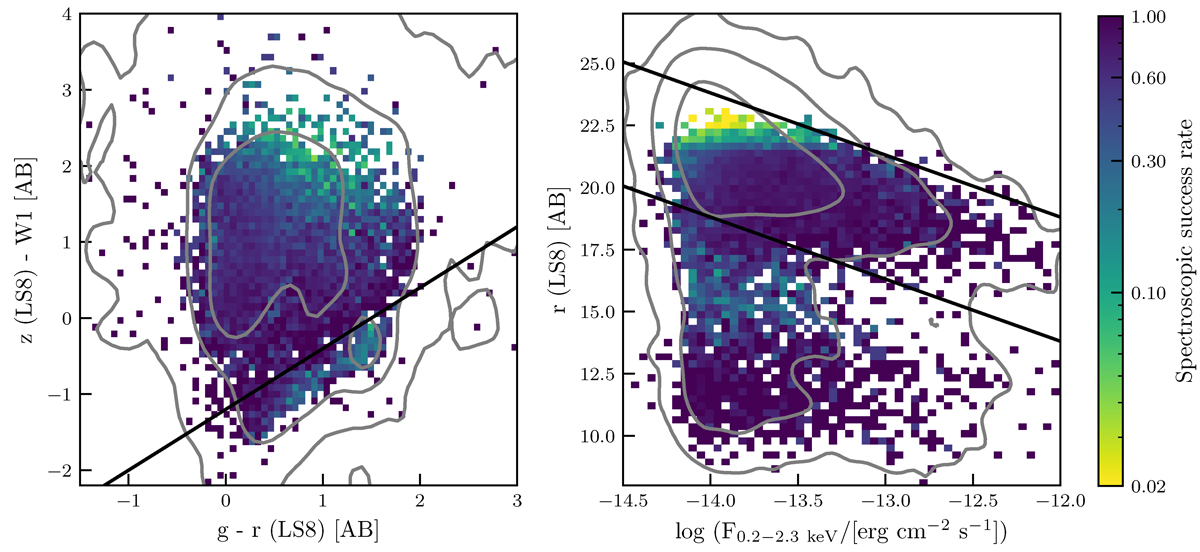
Colour-colour and flux-magnitude diagrams of the sources from the SDSS/eFEDS sample with reliable redshift (12 011 sources) in comparison to those with a reliable photometric counterpart (24 774 sources), as in Fig. 10. The colour-code is based on the spectroscopic success rate (i.e. N(NORMQ = 3)/N(CTP_QUALITY > 1)). The grey contours indicate the same contours as in Fig. 10 for the overall distribution of the X-ray sources with a reliable optical counterpart.
Current usage metrics show cumulative count of Article Views (full-text article views including HTML views, PDF and ePub downloads, according to the available data) and Abstracts Views on Vision4Press platform.
Data correspond to usage on the plateform after 2015. The current usage metrics is available 48-96 hours after online publication and is updated daily on week days.
Initial download of the metrics may take a while.