Fig. 5.
Download original image
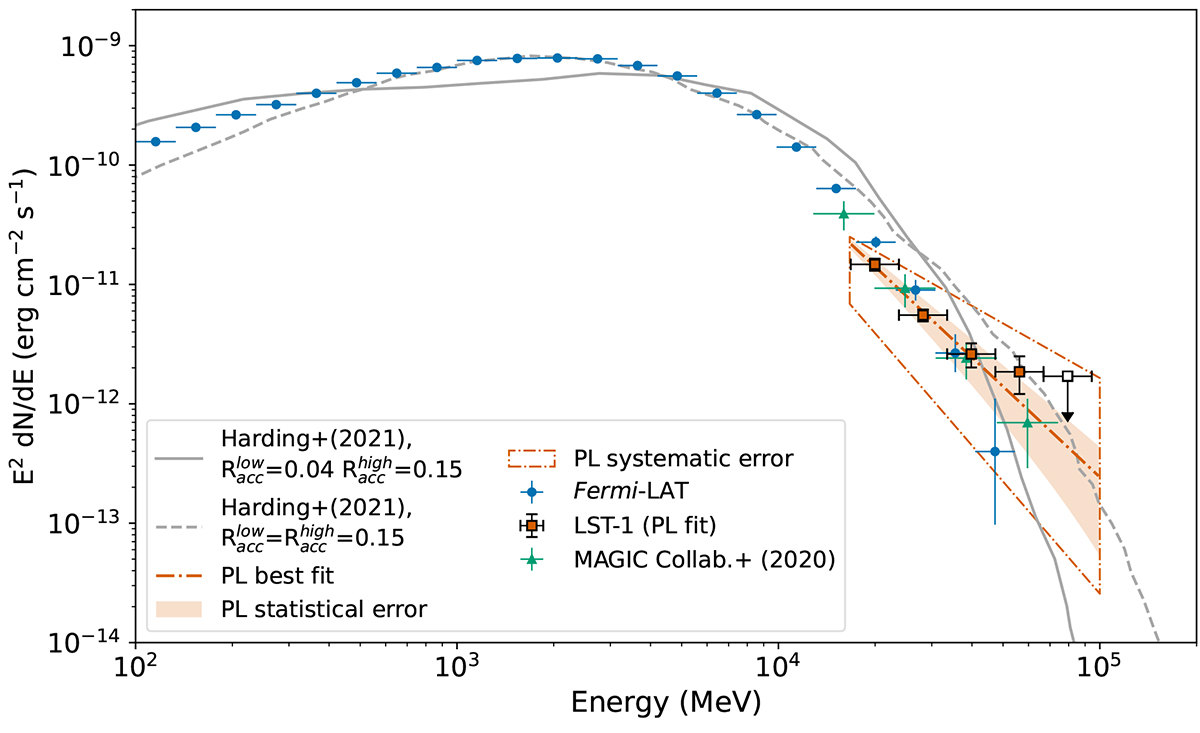
Adaptation of Fig. 10 of Harding et al. (2021) showing the two models derived in the paper for the SC emission of Geminga, together with the LST-1 P2 SED obtained in this work (same as Fig. 4). The Fermi-LAT and MAGIC points from the analysis presented in this work and MAGIC Collaboration (2020), respectively, are also reported for comparison. Note that the Fermi-LAT points represent the phase-averaged flux, i.e. they take into account the emission from both P1 and P2.
Current usage metrics show cumulative count of Article Views (full-text article views including HTML views, PDF and ePub downloads, according to the available data) and Abstracts Views on Vision4Press platform.
Data correspond to usage on the plateform after 2015. The current usage metrics is available 48-96 hours after online publication and is updated daily on week days.
Initial download of the metrics may take a while.