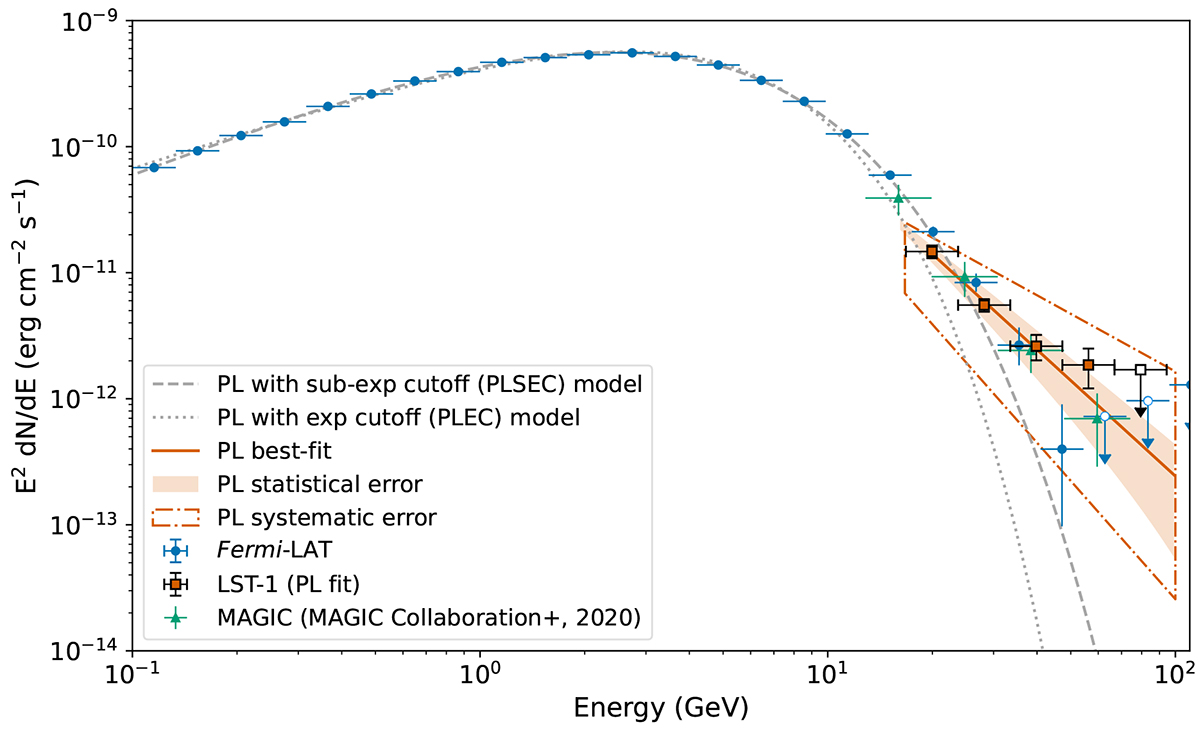
Fig. 4.
Download original image
Joint LST-1 (squares) and Fermi-LAT (circles) data samples of P2, along with the best-fit results of both the power law with an exponential cut-off (PLEC, dotted line) and the power law with sub-exponential cut-off (PLSEC, dashed line). The power law fit of the LST-1 only points (orange squares) is shown together with its statistical 1σ uncertainty band (solid line and shaded area) and the systematics uncertainty band (dash-dotted area), considering both the systematics on the index and the flux normalisation. The MAGIC Collaboration (2020) points are depicted as triangles for comparison. The horizontal error bars represent the width of the energy bins.
Current usage metrics show cumulative count of Article Views (full-text article views including HTML views, PDF and ePub downloads, according to the available data) and Abstracts Views on Vision4Press platform.
Data correspond to usage on the plateform after 2015. The current usage metrics is available 48-96 hours after online publication and is updated daily on week days.
Initial download of the metrics may take a while.