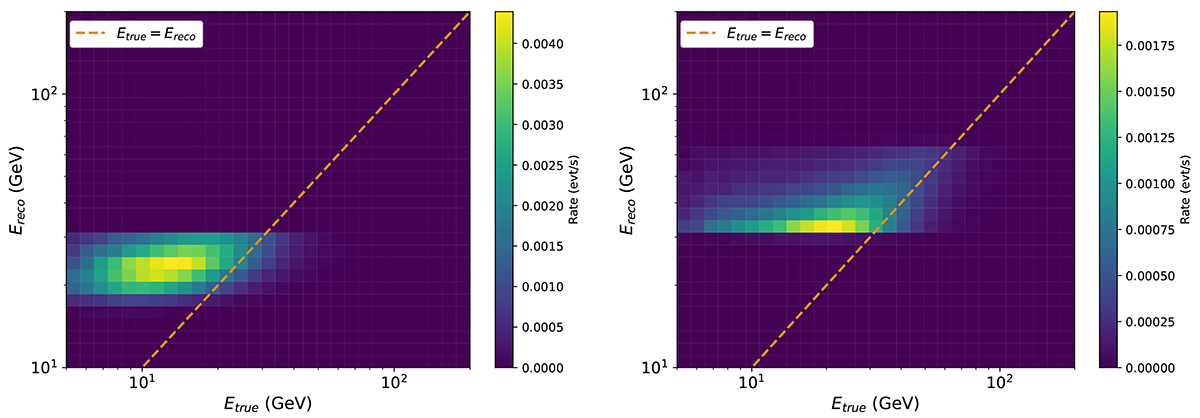
Fig. 3.
Download original image
Two-dimensional weighted (considering Geminga’s spectral index Γ = 4.5) histogram of the reconstructed energy versus the true energy, projected onto the true energy axis for the two reconstructed energy bins used for the morphological study of P2, [15, 31] GeV (left) and [31, 65] GeV (right). The Monte Carlo data used for the plots were produced at Zd = 10°. The dashed line represents the equivalence between the true energy Etrue and the reconstructed energy Ereco. The z-axis is in units of rate, i.e. events per second.
Current usage metrics show cumulative count of Article Views (full-text article views including HTML views, PDF and ePub downloads, according to the available data) and Abstracts Views on Vision4Press platform.
Data correspond to usage on the plateform after 2015. The current usage metrics is available 48-96 hours after online publication and is updated daily on week days.
Initial download of the metrics may take a while.