Fig. 1.
Download original image
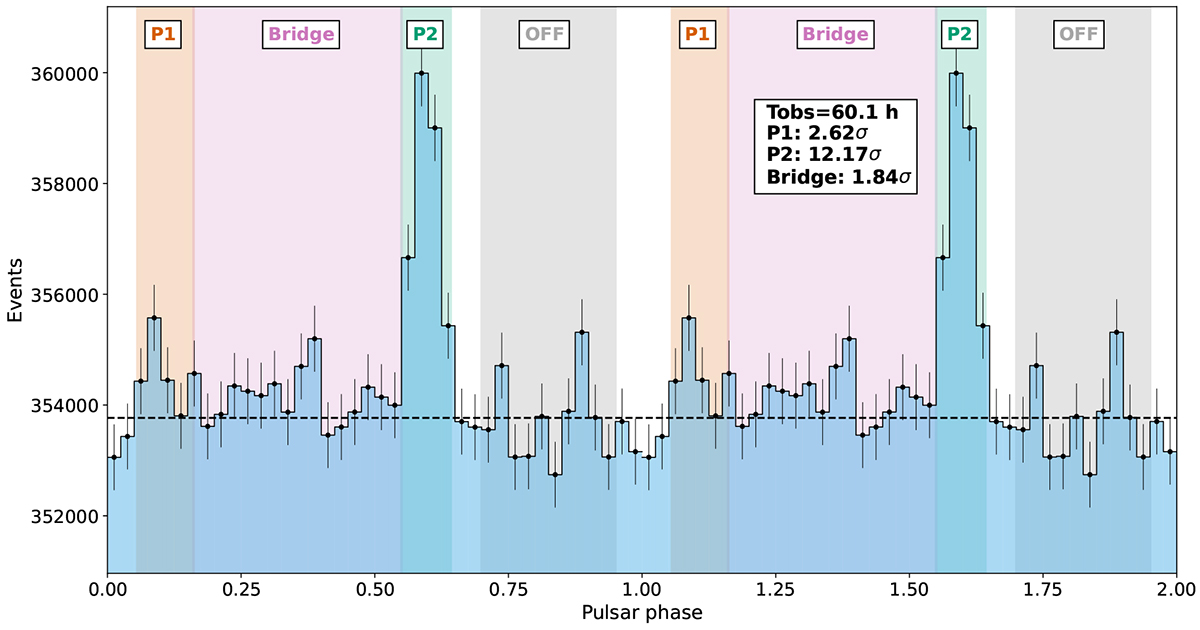
Phaseogram of the LST-1 observations of the Geminga shown over two rotational periods, with no cut in energy. The different phase regions (P1, P2, Bridge and background, or OFF) are highlighted in the plot. The average level of the background counts is reported as the horizontal dashed line. We also show the Li&Ma significance of both peaks and the inter-peak region and the total observation time.
Current usage metrics show cumulative count of Article Views (full-text article views including HTML views, PDF and ePub downloads, according to the available data) and Abstracts Views on Vision4Press platform.
Data correspond to usage on the plateform after 2015. The current usage metrics is available 48-96 hours after online publication and is updated daily on week days.
Initial download of the metrics may take a while.