Fig. 4
Download original image
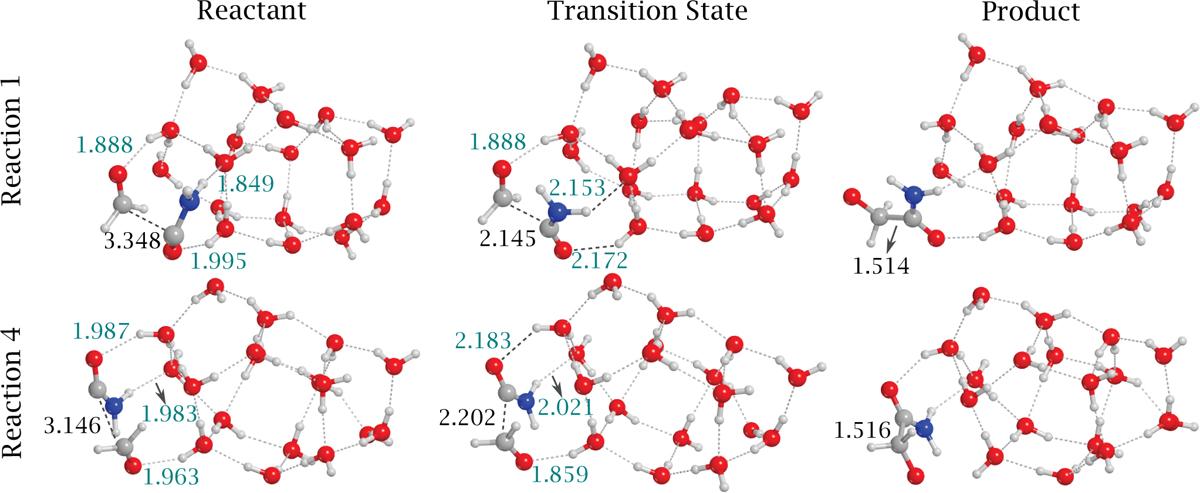
BHLYP-D3(BJ)/ma-def2-TZVP optimized structures of reactant, transition state, and product for Reactions (1) and (4) (those presenting the highest and the lowest energy barrier, respectively). Distances are in Å, those in teal refer to H-bond lengths. The atoms are color-coded as follows: red, oxygen; light gray, hydrogen; gray, carbon; blue, nitrogen. The geometries for Reaction 2 and 3 are available in the Appendix.
Current usage metrics show cumulative count of Article Views (full-text article views including HTML views, PDF and ePub downloads, according to the available data) and Abstracts Views on Vision4Press platform.
Data correspond to usage on the plateform after 2015. The current usage metrics is available 48-96 hours after online publication and is updated daily on week days.
Initial download of the metrics may take a while.