Open Access
Fig. 15
Download original image
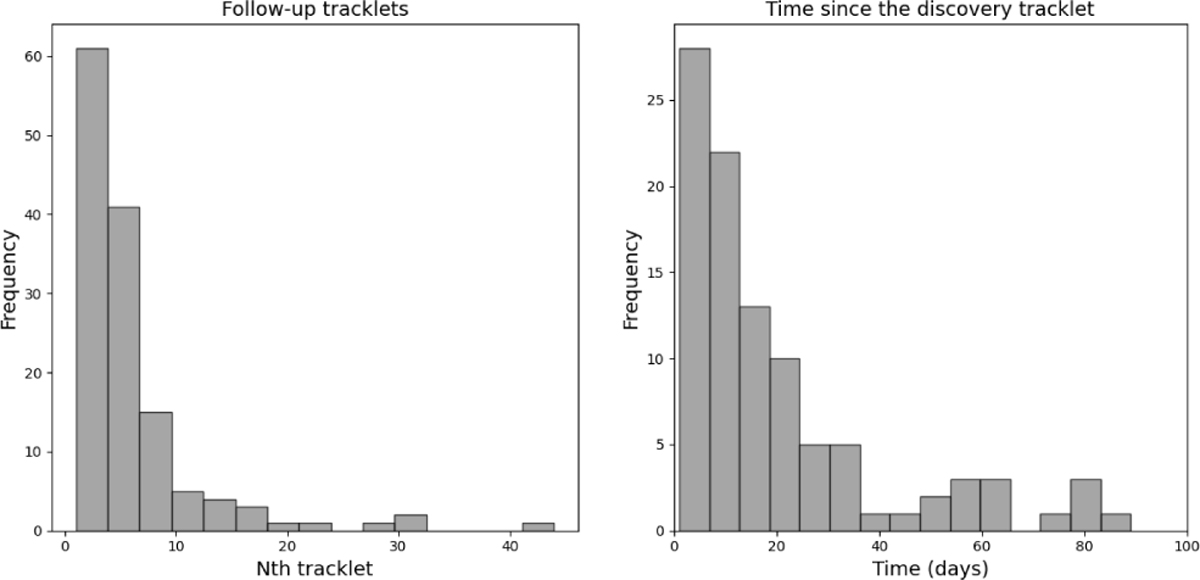
Histogram of the order of the first follow-up tracklet of initially misclassified NEOs that the ML model identified correctly (left). We also show the histogram of the time that elapsed since the original discovery tracklet (right) until the follow-up tracklet is classified correctly as a NEO for the first time.
Current usage metrics show cumulative count of Article Views (full-text article views including HTML views, PDF and ePub downloads, according to the available data) and Abstracts Views on Vision4Press platform.
Data correspond to usage on the plateform after 2015. The current usage metrics is available 48-96 hours after online publication and is updated daily on week days.
Initial download of the metrics may take a while.