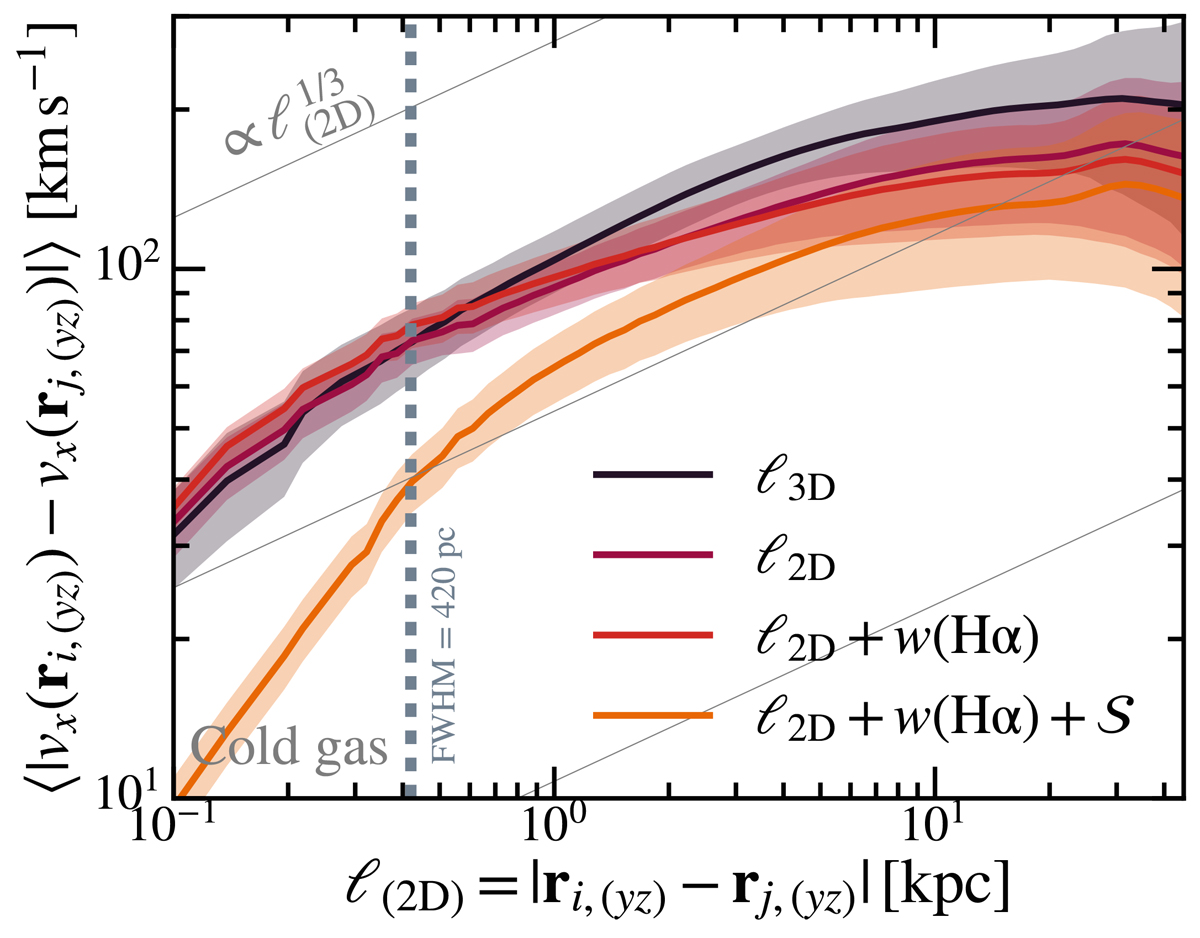
Fig. 8.
Download original image
Line-of-sight VSFs for the cold component and for the projected radius r ≤ 25 kpc averaged between 0.9 and 4 Gyr. The darkest curve (labeled ℓ3D) was obtained by taking the three-dimensional distance between pairs of points, similarly to Wang et al. (2021). For all the other curves, the VSFs were computed out of projected maps, and the corresponding separations scales are two dimensional (ℓ2D). The term w(Hα) indicates weighting of the map by Hα emission, and 𝒮 is the additional smoothing effect resulting from atmospheric seeing (see Li et al. 2020). The shaded areas indicate the time variation of each VSF.
Current usage metrics show cumulative count of Article Views (full-text article views including HTML views, PDF and ePub downloads, according to the available data) and Abstracts Views on Vision4Press platform.
Data correspond to usage on the plateform after 2015. The current usage metrics is available 48-96 hours after online publication and is updated daily on week days.
Initial download of the metrics may take a while.