Fig. 6.
Download original image
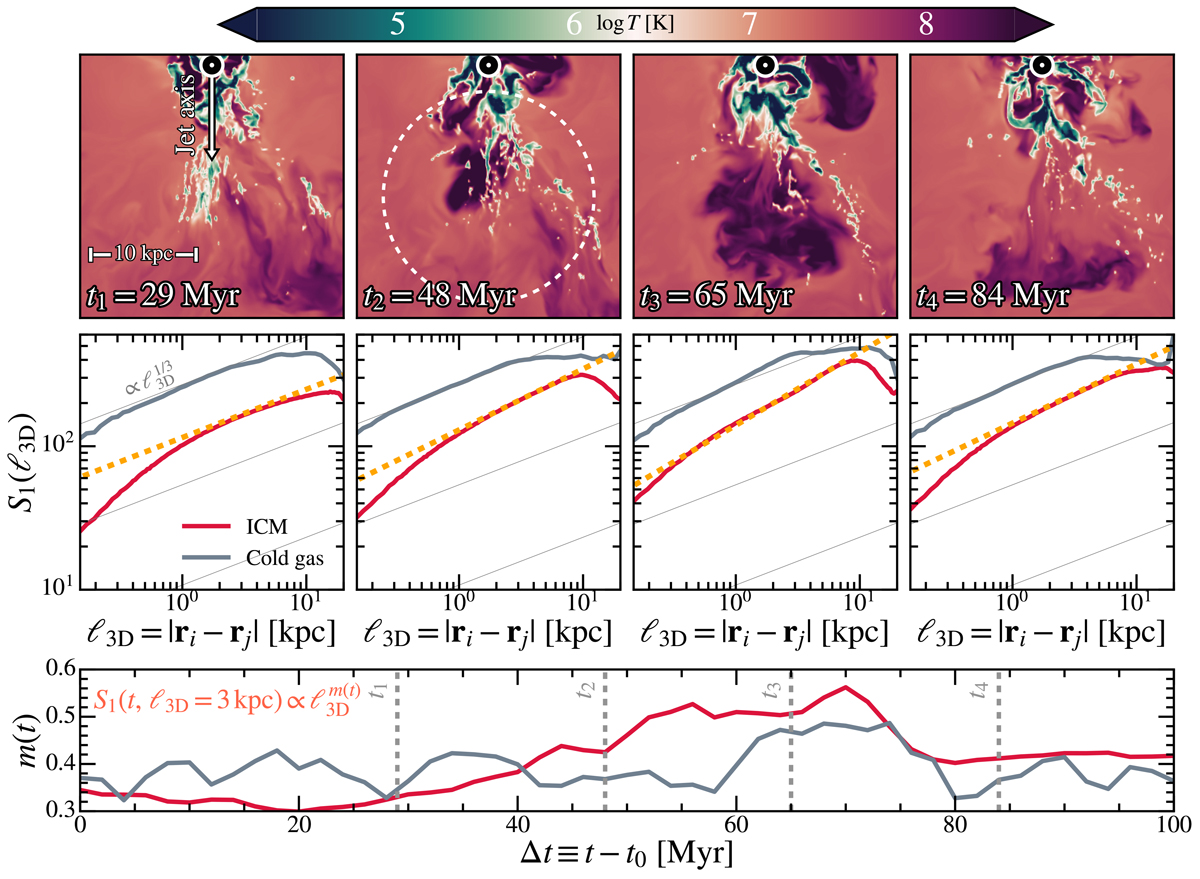
Top panels: temperature projection of the gas. The dashed circle indicates the sphere within which the VSF are computed, whose position is kept fixed throughout the run. The round marker at the top of the temperature projection indicates the position of the SMBH particle and the arrow shows the jet injection axis. The projection depth is 1 kpc. Middle panels: Velocity structure functions of the cold (gray curves) and hot (red curves) phases. The dashed orange lines indicate the fit of the power-law index of the hot phase VSF. Lower panel: Time evolution of the cold and hot phases power-law index. Here, t0 refers to the restarting time of the simulation.
Current usage metrics show cumulative count of Article Views (full-text article views including HTML views, PDF and ePub downloads, according to the available data) and Abstracts Views on Vision4Press platform.
Data correspond to usage on the plateform after 2015. The current usage metrics is available 48-96 hours after online publication and is updated daily on week days.
Initial download of the metrics may take a while.