Fig. 5.
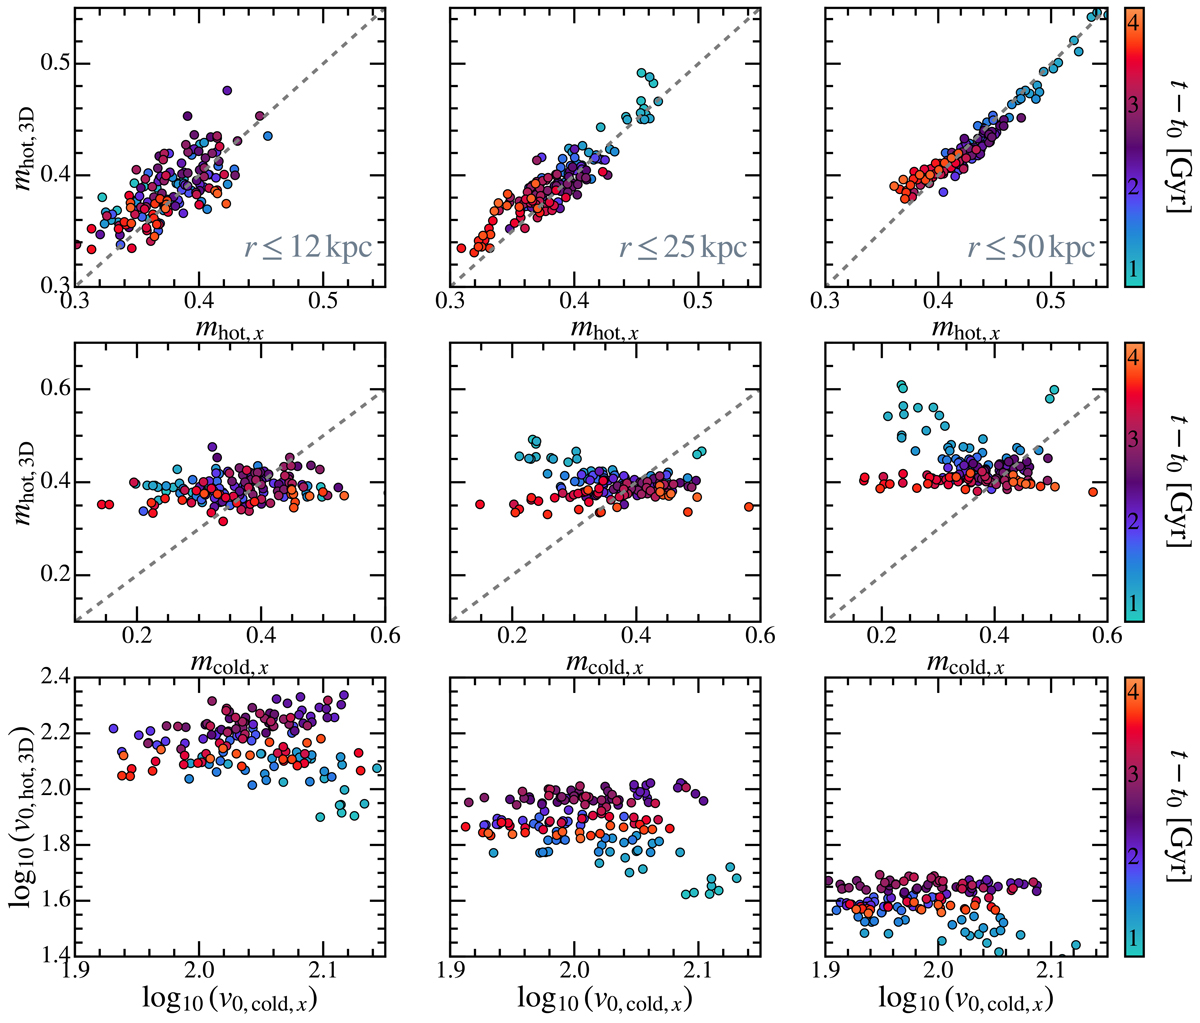
Download original image
Top panels: Relationship between the power-law index of the line-of-sight hot gas VSF and that of its three-dimensional counterpart. Middle (bottom) panels: Relationship between the power-law index m (amplitude v0) of the line-of-sight, cold phase VSF, and the three-dimensional hot phase VSFm, respectively. The color of the points represents time, with values ranging from 0.9 to 4.0 Gyr. The columns show VSF values for all gas within radii of 12, 25, and 50 kpc (left to right). The dashed gray line indicates the identity relationship and should not be interpreted as an attempt to fit the data. The light blue shaded area represents the region of the parameter space where the measured power-law index of the VSF is steeper than the m = 1/3 power-law index predicted by the Kolmogorov theory.
Current usage metrics show cumulative count of Article Views (full-text article views including HTML views, PDF and ePub downloads, according to the available data) and Abstracts Views on Vision4Press platform.
Data correspond to usage on the plateform after 2015. The current usage metrics is available 48-96 hours after online publication and is updated daily on week days.
Initial download of the metrics may take a while.